Study the bar graph and answer the given questions.
The bar graph shows the percentage growth of population in six countries in three years.
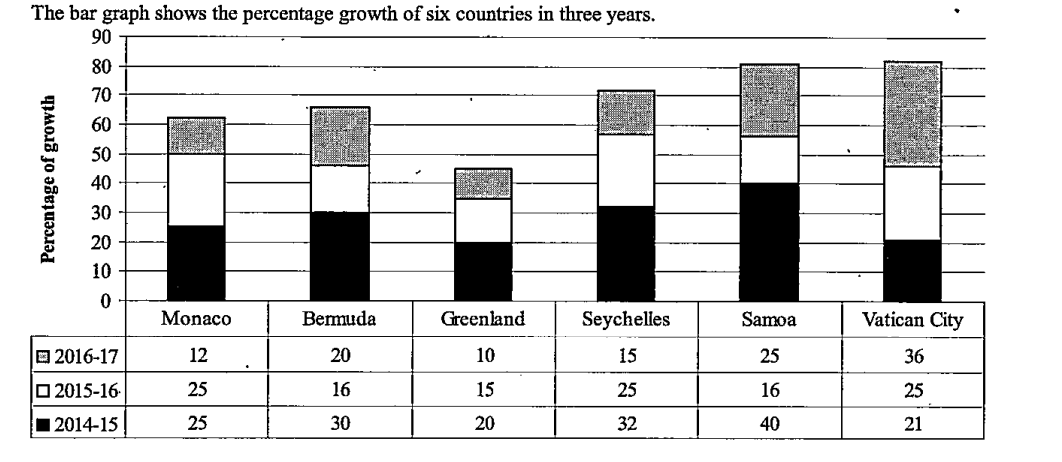
If the population of Samoa and Vatican City in the year 2014 was 12.5 lakh and 10 lakh respectively' then what is the difference between the population of Samoa and the population of Vatican city in the year 2017?
4.915 lakh
4.805 lakh
4.385 lakh
4.275 lakh
The correct Answer is:B
Step by step video, text & image solution for Study the bar graph and answer the given questions. The bar graph shows the percentage growth of population in six countries in three years. If the population of Samoa and Vatican City in the year 2014 was 12.5 lakh and 10 lakh respectively' then what is the difference between the population of Samoa and the population of Vatican city in the year 2017? by Maths experts to help you in doubts & scoring excellent marks in Class 14 exams.
Updated on:21/07/2023Similar Questions
The population of a town increases by 25% annually. If the present population is one crore, then what was the difference between the population 3 years ago and 2 years ago ?
View SolutionThe population of a town was 1,60,000 three years ago, If it increased by 3%, 2.5% and 5% respectively in the last three years, then the present population is
View Solution
Knowledge Check
The population of a town increases by 25% annually. If the present population is one crore, then what was the difference between the population 3 years ago and 2 years ago ?
A2500000B1280000C1560000DNone of theseThe population of a town increases by 25% annually. If the present population is one crore, then what was the difference between the population 3 years ago and 2 years ago ?
A2500000B1280000C1560000D2000000Study the following graph carefully and answer the questions that
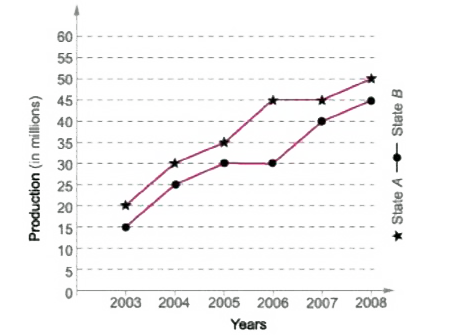
What was the percent rise in population of State A in 2007 from the previous year ?A25B3313C33DNone of these
Study the following graph to answer the given questions -----
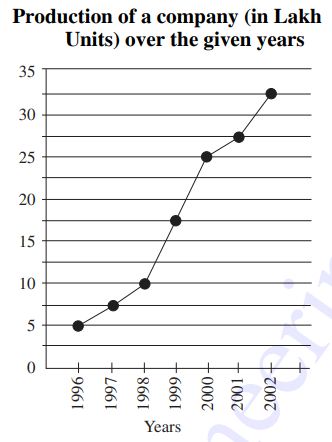
What is the approximate average production (in lakhs) for the given years ?
View SolutionStudy the following graph carefully and answer the questions that
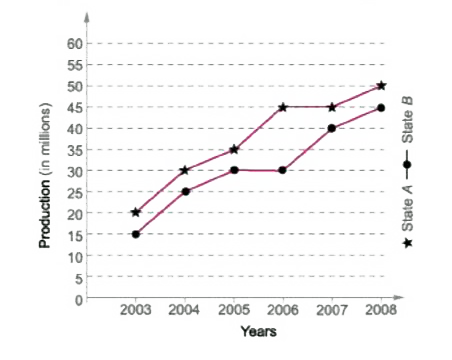
What was the average population of State B ( in millions ) for the years together ?
View SolutionStudy the following table and answer the questions based on it. What is the average population of state B (in lakh) for all the years together?
View SolutionStudy the following graph carefully and answer the questions that
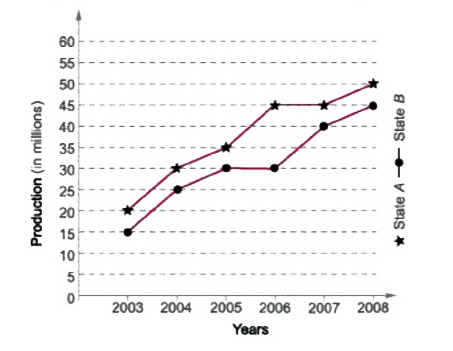
Population of State A in 2005 was what percent of its total population for all the years together ?
View SolutionStudy the following graph carefully and answer the questions that
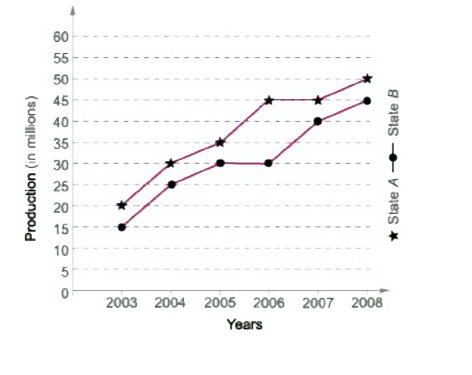
For state B , the percentage rise in population from the previous year was the highest in which of the following years ?
View Solution
