Study the following graph to answer the given questions -----
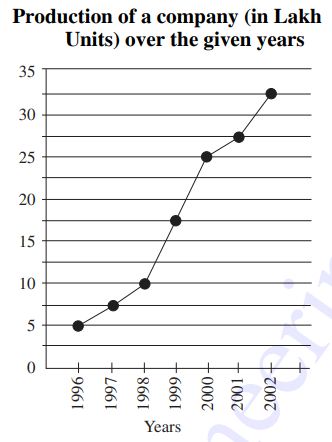
What is the approximate average production (in lakhs) for the given years ?
A
18
B
19
C
20
D
18.5
Video Solution
Text Solution
The correct Answer is:A
|
Answer
Step by step video, text & image solution for Study the following graph to answer the given questions ----- What is the approximate average production (in lakhs) for the given years ? by Maths experts to help you in doubts & scoring excellent marks in Class 14 exams.
Updated on:21/07/2023
Related Playlists
Knowledge Check
- Question 1 - Select One
Study the following table and answer the questions based on it. What is the average population of state B (in lakh) for all the years together?
A25.24B24.44C24.24D25.44 - Question 1 - Select One
Study the following graph carefully to answer these questions-
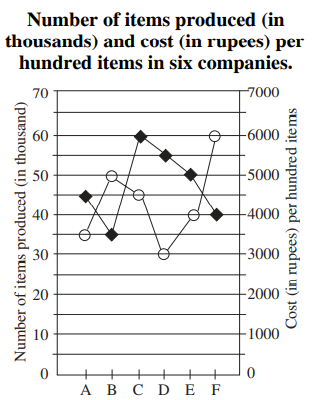
What is the average cost per hundred items for all the given companies?ARs. 4183 23BRs. 4184 13CRs. 433 23DNone of these - Question 1 - Select One
Study the following graph carefully and answer the questions that
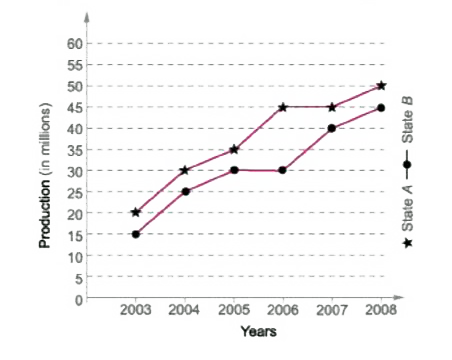
What was the average population of State B ( in millions ) for the years together ?A38.5B28.5C35D30.83 - Question 1 - Select One
Study the following graph carefully and answer the given questions.
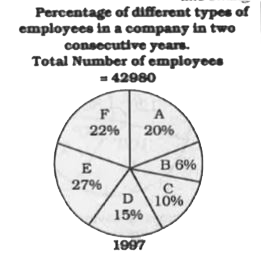
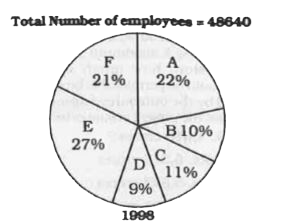
What was the approximate difference in the number of B type of employees during 1997 and 1998 ?A2285B2325C2620D2085 - Question 1 - Select One
Study the graph and answer the following questions-
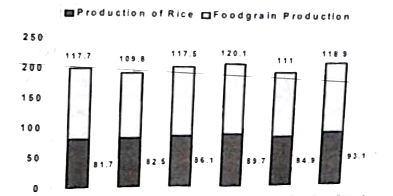
Over the given years what is average production of rice?A86.33 million tonnesB88.66 million tonnesC85 million tonnesD88 million tonnes - Question 1 - Select One
Study the following graph carefully and answer the questions that follow
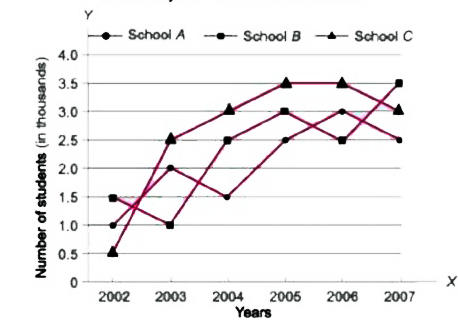
What was the approximate average number of students in school A over all the years together ?A1990B2090C2300D1800 - Question 1 - Select One
Study the following graph carefully and answer the questions that
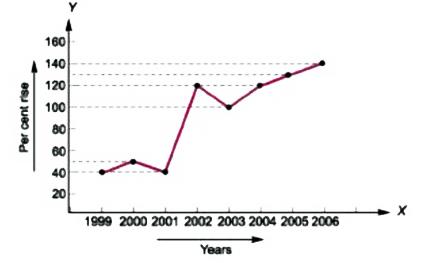
What was the average of percent rise over the given years ?A1.1B1.05C100.5%D92.5%
Similar Questions
Study the following graph carefully and answer the given questions.
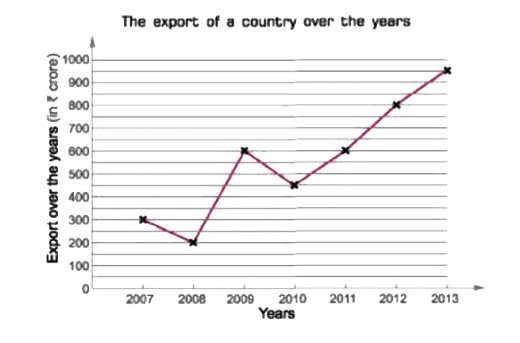
What is the total exports ( in ? Crore) for the given years ?View SolutionStudy the following graph carefully and answer the given questions.
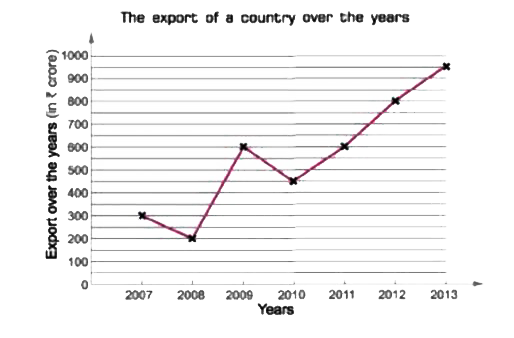
What is the percentage increase in exports from the lowest to the highest for the given years ?View SolutionStudy the following graph carefully and answer the given questions.
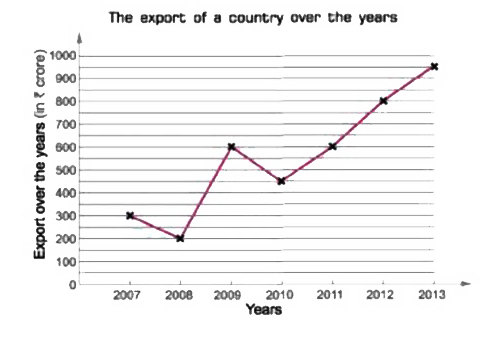
Exports in 2009 is approximately what per cent of that of year 2010 ?View Solution

