The following radar diagram show the number of new companies registered in four countries in various year study the following graph carefully and answer the question given below
In which of following years the average of the number of companies registered in the countries is maximum 
2008
2009
2010
2011
The correct Answer is:B
Step by step video, text & image solution for The following radar diagram show the number of new companies registered in four countries in various year study the following graph carefully and answer the question given belowIn which of following years the average of the number of companies registered in the countries is maximum by Maths experts to help you in doubts & scoring excellent marks in Class 14 exams.
Updated on:21/07/2023Similar Questions
Read the following graph carefully and answer the questions given below.
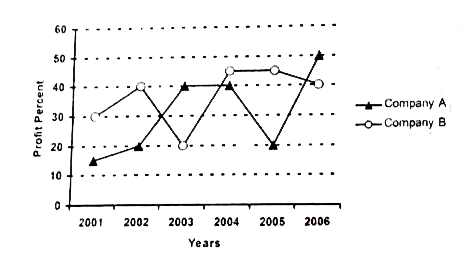
In which year the average of the profit percent of the both companies was the maximum ?
View SolutionStudy the following graph carefully and answer the questions that follow
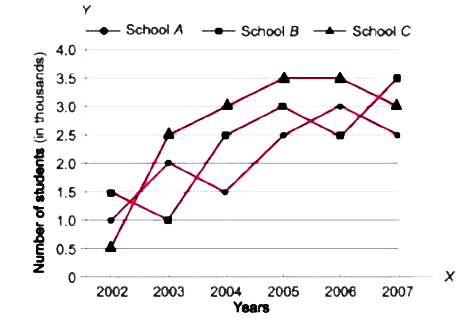
What was the average number of students in all schools together in the year 2006 ?
View Solution
Knowledge Check
Study the following graph carefully to answer the questions given below.
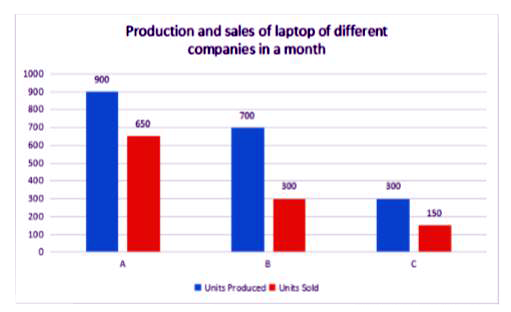
What is the average number of Units produced by all the Companies together?A62513B63313C63323D62313Study the following graph carefully and answer the questions that follow
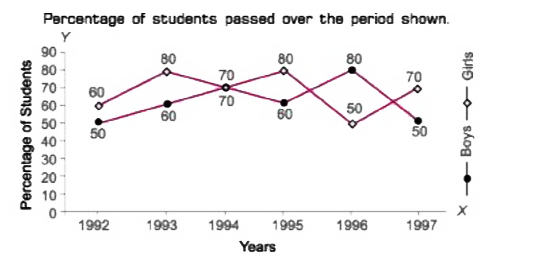
In which of the following years was the improvement of girls maximum as compared to that of previous years ?A1992B1993C1997D1995Study the following graph carefully to answer the questions given below.
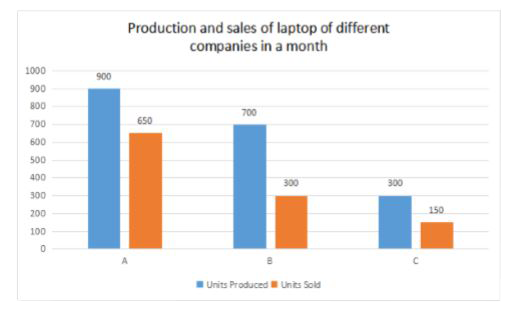
What is the average number of Units of laptop sold by all the Companies together?A41023B39123C36613D36623
Study the following graph carefully and answer the questions given below it -----
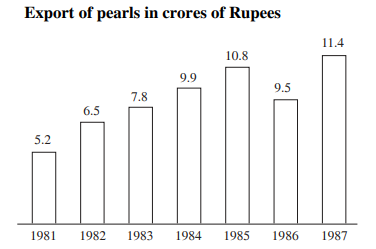
In which year was the export equal to the average export of the preceding and the following year ?
View SolutionStudy the following graph carefully and answer the questions that follow
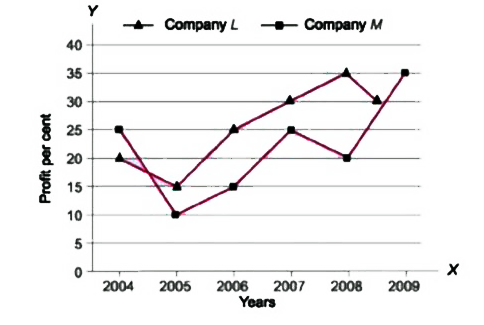
What was the average per cent rise in profit of company L over all the years together ?
View SolutionStudy the following line graph and answer the questions.
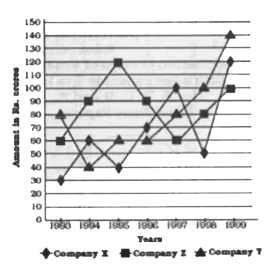
In which year was the exports of all three companies maximum ?
View SolutionStudy the following line graph and answer the questions.
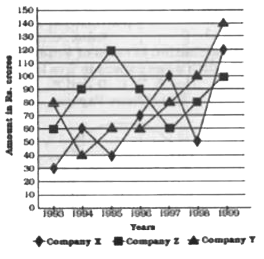
In which year was the difference between the exports of companies Y and Z maximum ?
View SolutionStudy the following graph carefully to answer these questions-
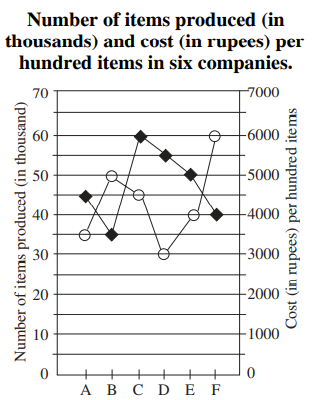
What is the average cost per hundred items for all the given companies?
View Solution