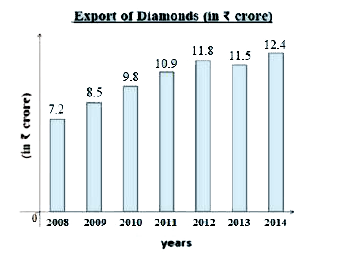
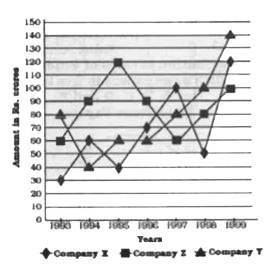
Study the following line graph and answer the questions.
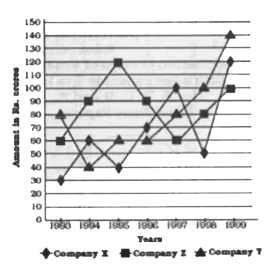
In which year was the exports of all three companies maximum ?
1996
1998
1995
1999
The correct Answer is:D
Step by step video, text & image solution for Study the following line graph and answer the questions. In which year was the exports of all three companies maximum ? by Maths experts to help you in doubts & scoring excellent marks in Class 14 exams.
Updated on:21/07/2023Topper's Solved these Questions
- STATISTICS AND DATA INTERPRETATIONBOOK - KIRAN PUBLICATIONCHAPTER - STATISTICS AND DATA INTERPRETATIONEXERCISE - TYPE-VII
363 Videos
- STATISTICS AND DATA INTERPRETATIONBOOK - KIRAN PUBLICATIONCHAPTER - STATISTICS AND DATA INTERPRETATIONEXERCISE - TYPE-VIII
8 Videos
- STATISTICS AND DATA INTERPRETATIONBOOK - KIRAN PUBLICATIONCHAPTER - STATISTICS AND DATA INTERPRETATIONEXERCISE - TYPE-V
38 Videos
- SIMPLIFICATIONBOOK - KIRAN PUBLICATIONCHAPTER - SIMPLIFICATIONEXERCISE - TEST YOURSELF
25 Videos
- TIME AND DISTANCEBOOK - KIRAN PUBLICATIONCHAPTER - TIME AND DISTANCEEXERCISE - Type -XI
74 Videos
Similar Questions
Knowledge Check
Study the following line graph and answer the questions.
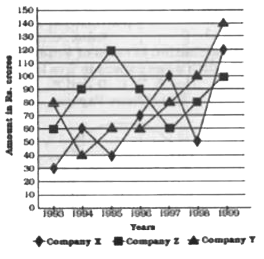
In which year was the difference between the exports of companies Y and Z maximum ?A1994B1997C1995D1996Study the following line graph and answer the questions.
What was the difference between the average exports of all three companies in 1994 and 1995 ?ARs. 5 croresBRs. 20 croresCRs. 10 croresDRs. 30 croresStudy the following graph carefully and answer the questions given below it -----
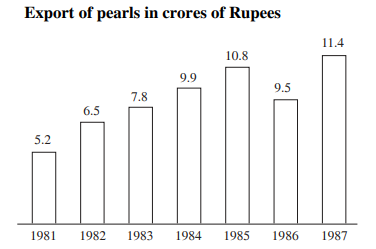
In which year was the export equal to the average export of the preceding and the following year ?A1982B1983C1985D1986
The following line graph shows the ratio of imports and exports of a company during a period of 1995-2001. Study the graph carefully and answer the questions.
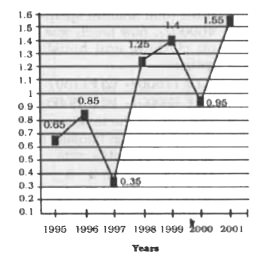
In which year was the ratio of imports to exports maximum ?
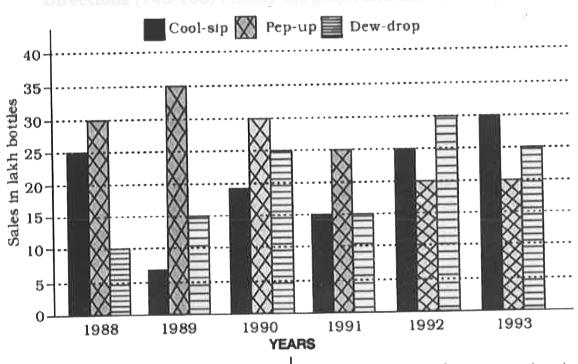
View SolutionStudy the graph and answer the questions.
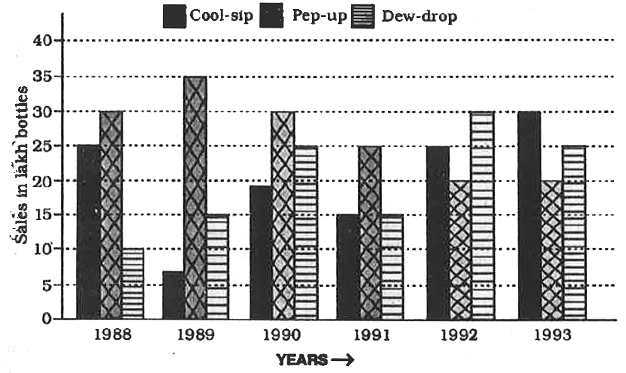
In which year sale of Drew-drop is maximum ?
View SolutionStudy the given graph and answer the question that follows.
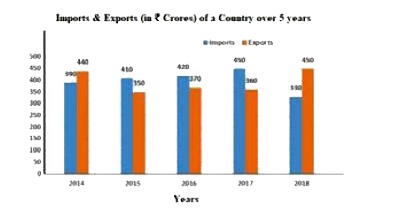
In which year are the exports of the country 87.5% of the average imports during 2016, 2017 and 2018 ?
View SolutionStudy the following graph carefully and answer the questions given below it -----
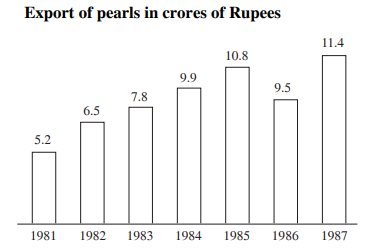
In which year there was maximum percentage increase in export of pearls to that in the previous year ?
View SolutionStudy the following graph and answer the questions.
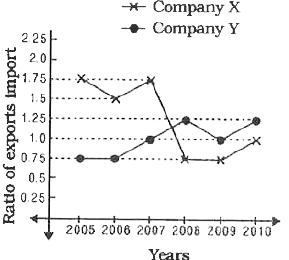
In 2005, the exports of company X were double that of company Y in that year. If the imports of company X during the year were Rs 180 crores, what was the amount (in crore Rs) on imports of company Y during the year ?
View Solution

