The following line graph shows the ratio of imports and exports of a company during a period of 1995-2001. Study the graph carefully and answer the questions.
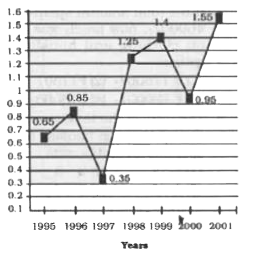
Of the given years. In how many years was the export less than import ?
4
2
1
3
The correct Answer is:D
Step by step video, text & image solution for The following line graph shows the ratio of imports and exports of a company during a period of 1995-2001. Study the graph carefully and answer the questions. Of the given years. In how many years was the export less than import ? by Maths experts to help you in doubts & scoring excellent marks in Class 14 exams.
Updated on:21/07/2023Topper's Solved these Questions
- STATISTICS AND DATA INTERPRETATIONBOOK - KIRAN PUBLICATIONCHAPTER - STATISTICS AND DATA INTERPRETATIONEXERCISE - TYPE-VII
363 Videos
- STATISTICS AND DATA INTERPRETATIONBOOK - KIRAN PUBLICATIONCHAPTER - STATISTICS AND DATA INTERPRETATIONEXERCISE - TYPE-VIII
8 Videos
- STATISTICS AND DATA INTERPRETATIONBOOK - KIRAN PUBLICATIONCHAPTER - STATISTICS AND DATA INTERPRETATIONEXERCISE - TYPE-V
38 Videos
- SIMPLIFICATIONBOOK - KIRAN PUBLICATIONCHAPTER - SIMPLIFICATIONEXERCISE - TEST YOURSELF
25 Videos
- TIME AND DISTANCEBOOK - KIRAN PUBLICATIONCHAPTER - TIME AND DISTANCEEXERCISE - Type -XI
74 Videos
Similar Questions
The following graph given the annual percent profit earned by a comppany during the period 1996-2001. Study the graph carefully and answer the questions that follow.
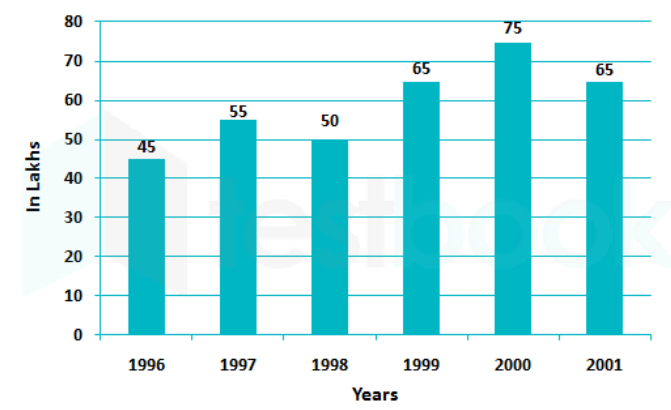
The perofit earned by the company is maximum is the year :
View SolutionThe following graph given the annual percent profit earned by a company during the period 1996-2001. Study the graph carefully and answer the questions that follow.
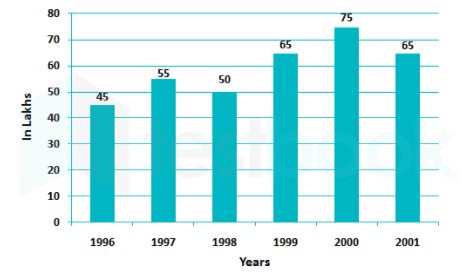
The expenditure of the company during the year 1996 was 30 crores. The income of the company in that year was (in crores ):
View Solution
Knowledge Check
The following line graph shows the ratio of imports and exports of a company during a period of 1995-2001. Study the graph carefully and answer the questions.
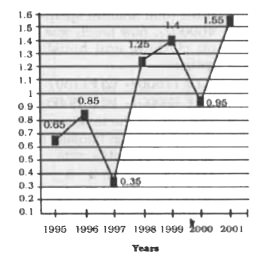
In which year was the ratio of imports to exports maximum ?A2000B1998C1996D2001The following line graph shows the ratio of imports and exports of a company during a period of 1995-2001. Study the graph carefully and answer the questions.
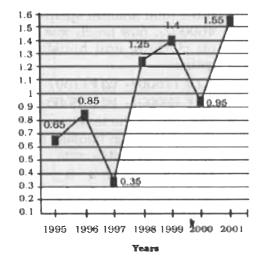
If the value of imports by the company in 1995 was Rs. 247 crores, what was the value of its exports in 1995?ARs. 275 croresBRs. 280 croresCRs. 370 croresDRs. 380 croresStudy the following graph carefully and answer the questions given below it -----
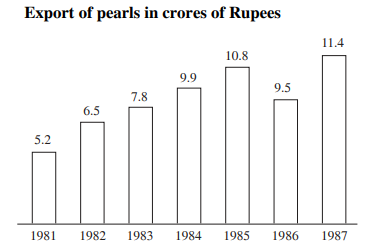
In how many years was the export above the average for the given period ?A2B3C4D5
The following graph given the annual percent profit earned by a company during the period 1996-2001 . Study the graph carefully and answer the questions that follow

The period in which the profit of the company has increased fasted is:
View SolutionThe following graph given the annual percent profit earned by a comppany during the period 1996-2001. Study the graph carefully and answer the questions that follow.
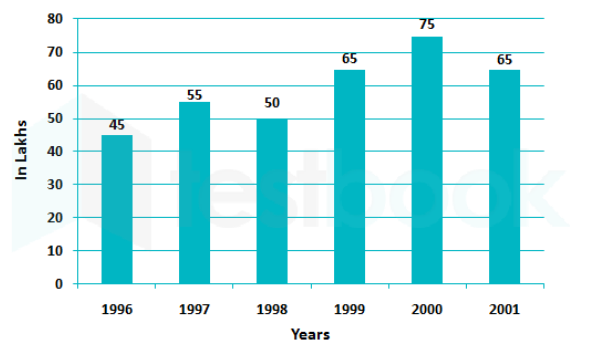
The period in which the profit of the company has increased faster is :
View SolutionStudy the following graph carefully and answer the questions that
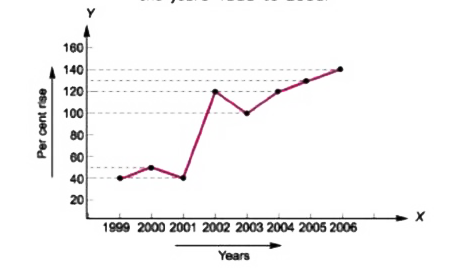
For how many years , the percent rise was more than 100 % ?
View SolutionStudy the graph carefully and answer the following questions.
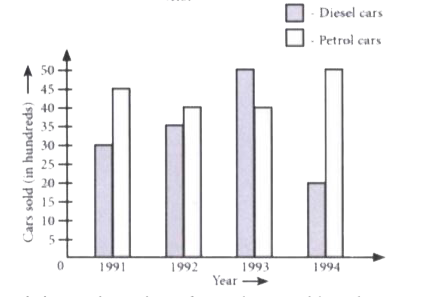
How many cars were sold during the year 1991?
View SolutionThe following graph represents the annual percentage profit earned by a company during the pe.riod 1996 - 2001. Study the graph carefully and answer the questions that follow .
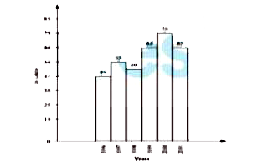
The profit earned by the company is maximum in the year:
View Solution
