Study the table and answer the given questions.
Data regarding the number of people (both literate and illiter) who attended a workshop
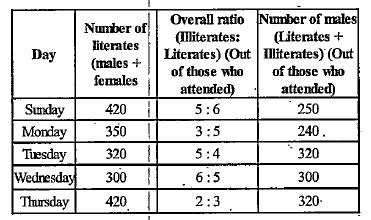
Total number who attended =Number of Literates +Number of IIIiterates
The total number of people (literates + illiterates) who attended the workshop on Sunday was what per cent more than those who attended on Thursday?
7
15
10
15
The correct Answer is:C
Step by step video, text & image solution for Study the table and answer the given questions. Data regarding the number of people (both literate and illiter) who attended a workshop Total number who attended =Number of Literates +Number of IIIiterates The total number of people (literates + illiterates) who attended the workshop on Sunday was what per cent more than those who attended on Thursday? by Maths experts to help you in doubts & scoring excellent marks in Class 14 exams.
Updated on:21/07/2023Similar Questions
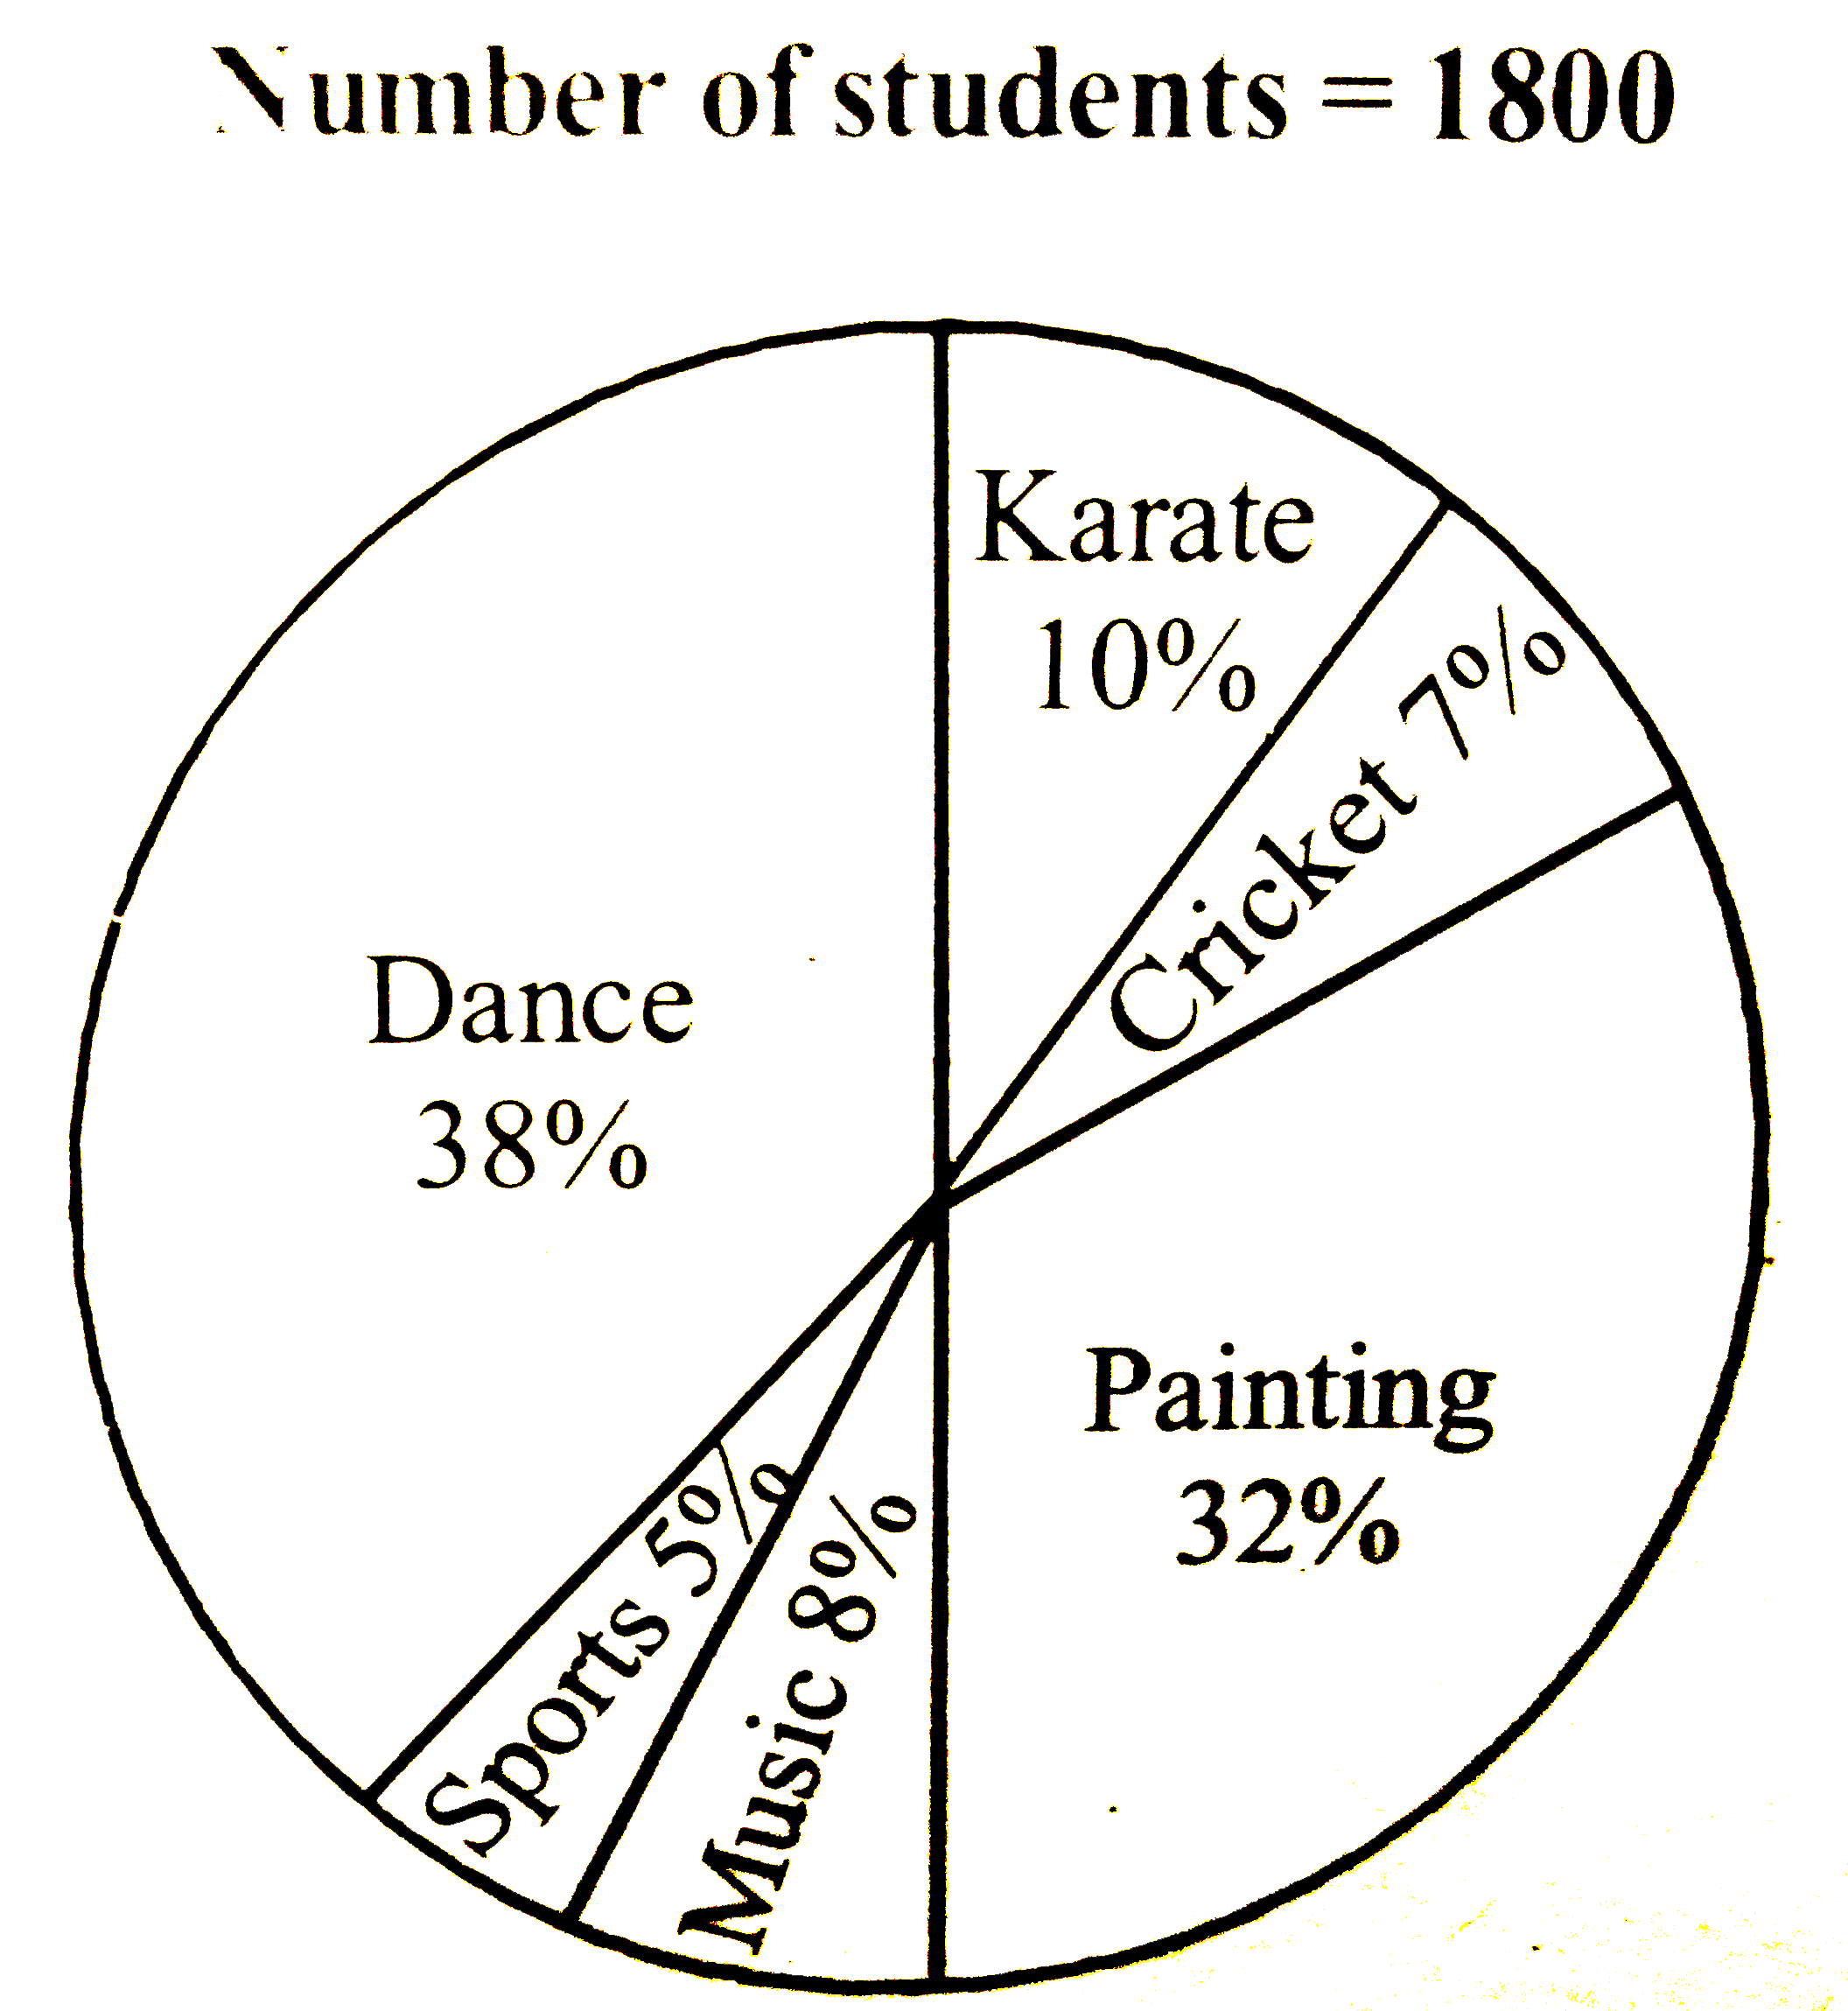
By what percent is the number of candidats who opted for music more than those who opted for sports ?
View SolutionStudy the following histogram and answer the given question.
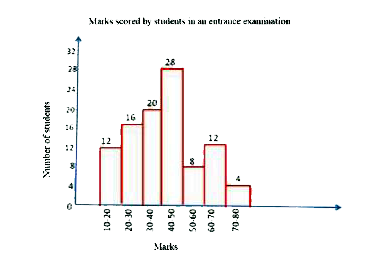
What is the ratio of the number of students who scored 30 or more marks, but below 40 marks, to the total number of students in the entrance examination?
View Solution
Knowledge Check
In a city 20% people are literates. If the number of literate people is 5000, then what is the total number of people?
A25000B35000C20000D40000Study the diagram given below and answer the questions that follow by selecting the appropriate responses.
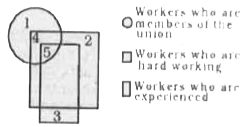
What is the total number of workers in the factory who are the members of the union?A21B10C4D5
Direction: Study the following information carefully and answer the given questions. The table shows the total number of invited person and the percentage of person who attended the events (A, B, C, D, E) respectively.
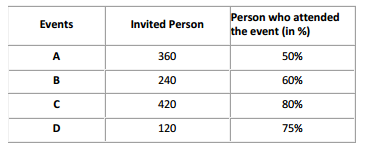
Find the percentage of persons who attended the event A is how much more than the number of persons who attended the event D.
View SolutionDirection: Study the following information carefully and answer the given questions. The table shows the total number of invited person and the percentage of person who attended the events (A, B, C, D, E) respectively.
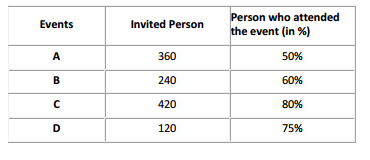
What is the ratio of the number of persons who attended event B to the number of persons who attended the event C?
View SolutionDirection: Study the following information carefully and answer the given questions. The table shows the total number of invited person and the percentage of person who attended the events (A, B, C, D, E) respectively.
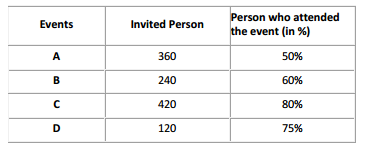
What is the average of number of persons who attended the events C, D and E?
View SolutionDirection: Study the following information carefully and answer the given questions. The table shows the total number of invited person and the percentage of person who attended the events (A, B, C, D, E) respectively.
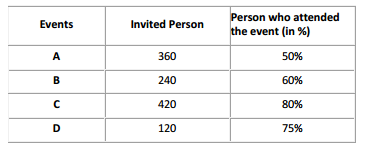
Find the difference between the number of persons who attended the events C and D and the number of persons who attended the events B and E.
View SolutionDirection: Study the following information carefully and answer the given questions. The table shows the total number of invited person and the percentage of person who attended the events (A, B, C, D, E) respectively.
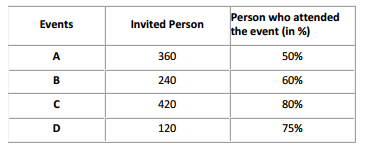
Find the ratio of number of persons who did not attend the event B to the total number of persons who were invited for event D.
View SolutionThe following data shows the number of students who attended the school on weekdays. Draw a bar graph to represent information by using appropriate scale.

View Solution
