Direction: Study the following information carefully and answer the given questions.
The table shows the total number of invited person and the percentage of person who attended
the events (A, B, C, D, E) respectively.
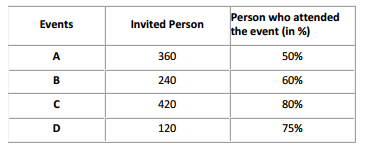
Find the ratio of number of persons who did not attend the event B to the total number of persons
who were invited for event D.
2:3
4:5
2:5
3:5
Step by step video & image solution for Direction: Study the following information carefully and answer the given questions. The table shows the total number of invited person and the percentage of person who attended the events (A, B, C, D, E) respectively.Find the ratio of number of persons who did not attend the event B to the total number of persons who were invited for event D. by Maths experts to help you in doubts & scoring excellent marks in Class 14 exams.
Updated on:21/07/2023Similar Questions
Direction: Study the following information carefully and answer the given questions. The table shows the total number of invited person and the percentage of person who attended the events (A, B, C, D, E) respectively.
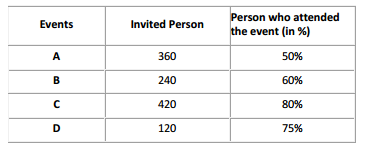
What is the average of number of persons who attended the events C, D and E?
View SolutionDirection: Study the following information carefully and answer the given questions. The table shows the total number of invited person and the percentage of person who attended the events (A, B, C, D, E) respectively.
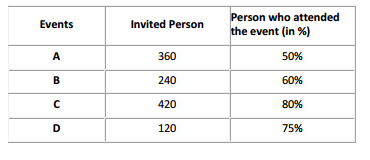
What is the ratio of the number of persons who attended event B to the number of persons who attended the event C?
View Solution
Knowledge Check
Study the following histogram and answer the questions.
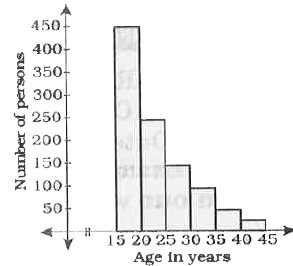
The total number of persons in the age group of 15 years to 45 years is :A450B800C1000D500Study the following histogram and answer the questions.
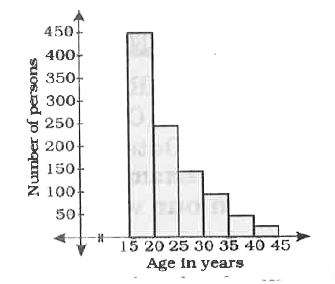
The ratio of maximum population in an age group to the total number of persons under study is :A4:5B9:10C9:20D2:5Directions: Study the given table carefully and answer the question that follows.
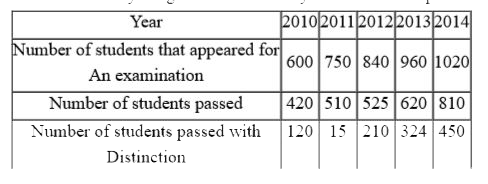
The percentage of students who have passed with distinction in the year 2012, is:A0.2B0.27C0.25D0.22
Direction: Study the following information carefully and answer the given questions. The table shows the total number of invited person and the percentage of person who attended the events (A, B, C, D, E) respectively.
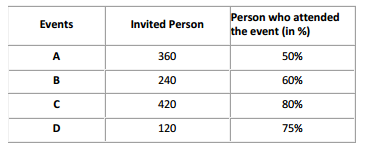
Find the percentage of persons who attended the event A is how much more than the number of persons who attended the event D.
View SolutionDirection: Study the following information carefully and answer the given questions. The table shows the total number of invited person and the percentage of person who attended the events (A, B, C, D, E) respectively.
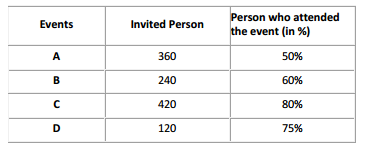
Find the difference between the number of persons who attended the events C and D and the number of persons who attended the events B and E.
View SolutionDirection: Read the following table carefully and answer the following questions: The table shows the total number of students and the number of girls in three schools A, B & C in two consecutive years.

Find the ratio of the total number of boys of school A and B together in year 1999 to the number of boys of school B and C together in 2000.
View SolutionDirection: Read the following table carefully and answer the questions given below:- The given the table is showing the number of students in different school:-
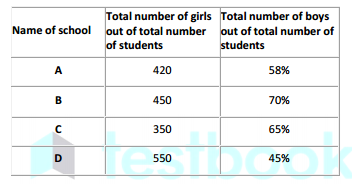
Find the ratio between the total number of boys in school D and the total number of girls in school A.
View SolutionDirection: Read the following information carefully and answer the questions that follow: A certain number of persons are sitting in a row facing north. There are 3 persons sitting between A and B. F sits third from one of the extreme ends. Five persons are sitting between B and D. There are more than two persons between F and D. D sits fifth from the left end. A does not sit second to the right of D. Only four persons are there between A and F. E sits exactly between A and B. G sits third to the left of D. One person sits between B and C
How many persons are sitting between A and C?
View Solution
