Refer to the graph and answer the given questions.
Data related to number of calories burned by two individuals (A and B) on treadmill during 5 days
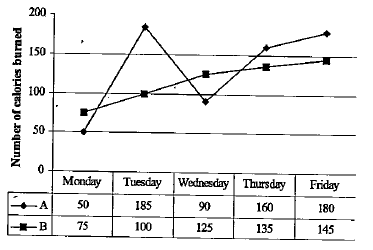
If the -average number of calories burned by B on Thursday, Friday and Saturday together is 125, what was the number of calories burned by B on Saturday?
110
95
115
90
The correct Answer is:B
Step by step video, text & image solution for Refer to the graph and answer the given questions. Data related to number of calories burned by two individuals (A and B) on treadmill during 5 days If the -average number of calories burned by B on Thursday, Friday and Saturday together is 125, what was the number of calories burned by B on Saturday? by Maths experts to help you in doubts & scoring excellent marks in Class 14 exams.
Updated on:21/07/2023Similar Questions
Directions: Refer to the following graph and answer the given questions. Data related to the number of shoes sold by two stores (A and B )during five years:
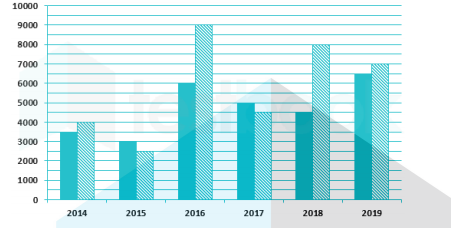
Find the ratio between the total number of shoes sold by stores A and B together in 2016 to the total number of shoes sold by stores A and B together in 2018?
View SolutionObserve the bar graph and answer the following questions.
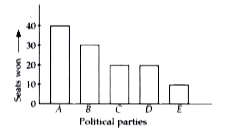
What is the total number of seats won by party A and party B?
View Solution
Knowledge Check
Ready the following graph carefully and answer the questions given below.
Number of passed students (boys and girls) from different colleges in a year (in thousands)
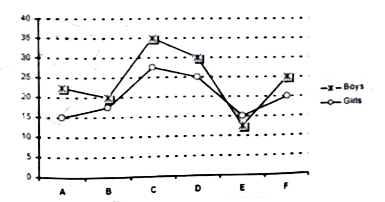
What is the average number of passed girls in all colleges together ?A17000B15000C16000D20000Refer the following data table and answer the following question.
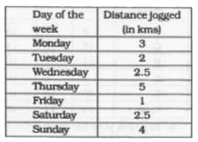
If 400 calories are burnt by jogging 5 km, how many calories were burnt in the given week?A1410 caloriesB1360 caloriesC1310 caloriesD1260 caloriesStudy the following graph carefully and answer the given questions.
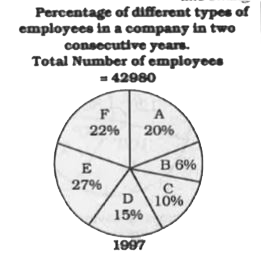
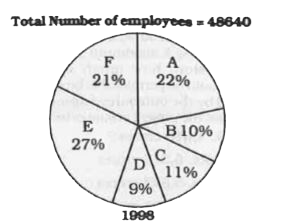
What was the approximate difference in the number of B type of employees during 1997 and 1998 ?A2285B2325C2620D2085
Directions: Refer to the following graph and answer the given questions. Data related to the number of shoes sold by two stores (A and B )during five years:
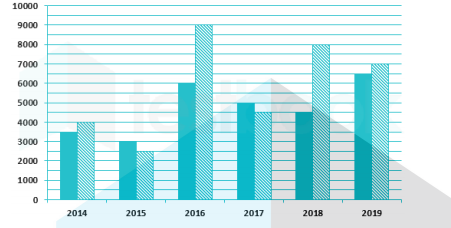
What is the difference between the total number of shoes sold by store A in 2018 and 2019 together and the total number of shoes sold by store B in 2014 and 2015 together?
View SolutionDirections: Refer to the following graph and answer the given questions. Data related to the number of shoes sold by two stores (A and B )during five years:
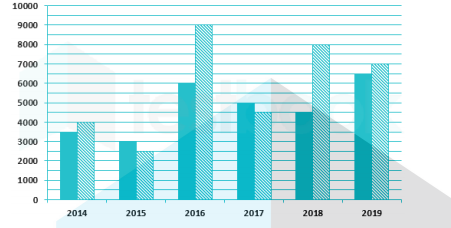
The number of shoes sold by store A decreased by what percent from 2017 to 2018?
View SolutionDirections: Refer to the following graph and answer the given questions. Data related to the number of shoes sold by two stores (A and B )during five years:
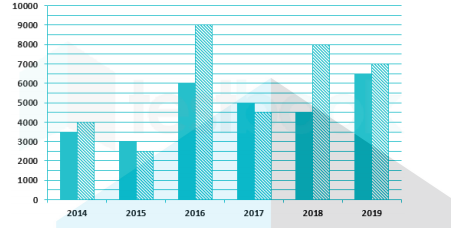
If the respective ratio between the total number of shoes sold by stores A and B together in 2014 and that in 2020 is 5 : 7.What is the total number of shoes sold by stores A and B together in 2020?
View SolutionDirections: Refer to the following graph and answer the given questions. Data related to the number of shoes sold by two stores (A and B )during five years:
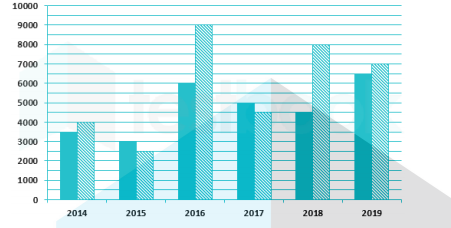
Find the difference between the total number of Shoes sold by Store A and B in all the years together?
View SolutionStudy the line graph given below to answer the following questions.
The line graph given below shows the percentage of orders delivered from Monday to Saturday of week III out of the orders received on Sunday of Week II and it also shows the number of orders returned on any given day as a percentage of total number of orders delivered till previous day.
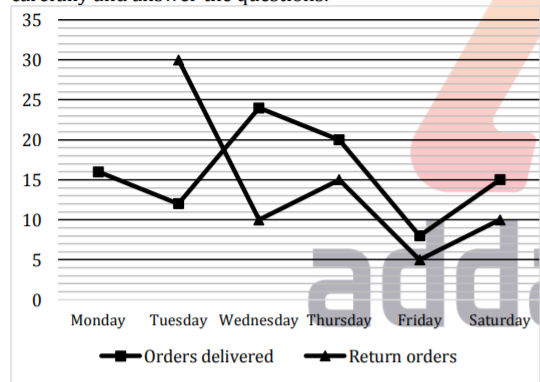
Note: • Number of orders which were yet to be delivered after Saturday of week III were 25.
• Orders cannot be returned on the same day of delivery. It has to be returned on next day of delivery and no order was returned on Sunday of Week III.
If the average number of orders returned from Tuesday to Sunday of week III is 30, then the number of orders returned on Sunday of week III is what percent more/less than the number of orders returned on Tuesday of week III?
View Solution
