Refer to the graph and answer the given questions.
Number of members who have registered
for two clubs in five different months
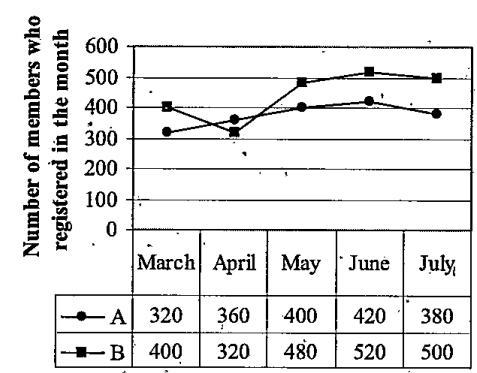
What is the ratio of the total number of members who registered for both the clubs together in March to that in July?
0.38402777777778
0.25902777777778
0.30347222222222
0.818181818
The correct Answer is:D
Step by step video, text & image solution for Refer to the graph and answer the given questions. Number of members who have registered for two clubs in five different months What is the ratio of the total number of members who registered for both the clubs together in March to that in July? by Maths experts to help you in doubts & scoring excellent marks in Class 14 exams.
Updated on:21/07/2023Similar Questions
Directions: Refer to the following graph and answer the given questions. Data related to the number of shoes sold by two stores (A and B )during five years:
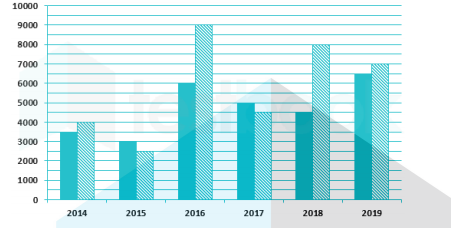
Find the ratio between the total number of shoes sold by stores A and B together in 2016 to the total number of shoes sold by stores A and B together in 2018?
View SolutionDirections: Refer to the following graph and answer the given questions. Data related to the number of shoes sold by two stores (A and B )during five years:
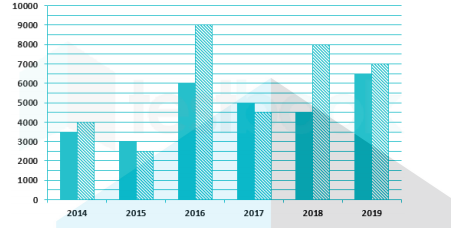
If the respective ratio between the total number of shoes sold by stores A and B together in 2014 and that in 2020 is 5 : 7.What is the total number of shoes sold by stores A and B together in 2020?
View Solution
Knowledge Check
Study the Pie chart carefully and answer the questions.
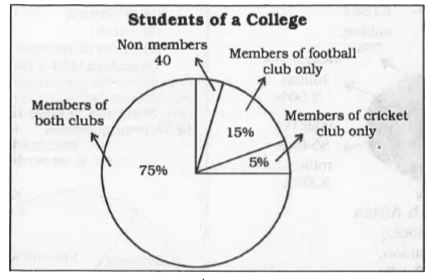
Number of students who are members of cricket club only :A35B40C42D41Study the Pie chart carefully and answer the questions.
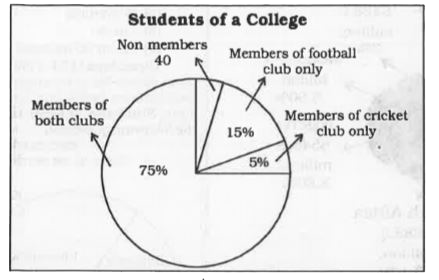
The number of students who are members of both the club is :A500B650C550D600Direction: Study the graph and answer the following question.
The graph shows the total number of boys and girls in different classes of a school.
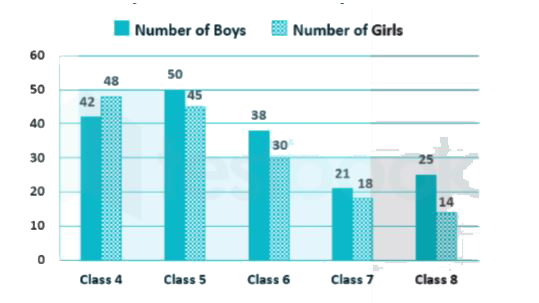
What is the total number of boys in these 5 classes together?A196B148C176D166
Directions: Refer to the following graph and answer the given questions. Data related to the number of shoes sold by two stores (A and B )during five years:
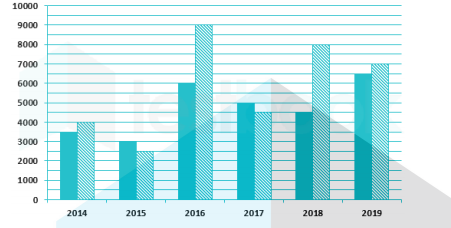
What is the difference between the total number of shoes sold by store A in 2018 and 2019 together and the total number of shoes sold by store B in 2014 and 2015 together?
View SolutionDirections: Refer to the following graph and answer the given questions. Data related to the number of shoes sold by two stores (A and B )during five years:
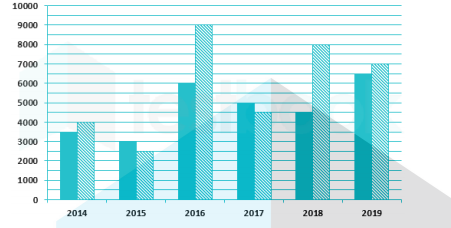
Find the difference between the total number of Shoes sold by Store A and B in all the years together?
View SolutionDirection: Study the graph and answer the following question. The graph shows the total number of boys and girls in different classes of a school.
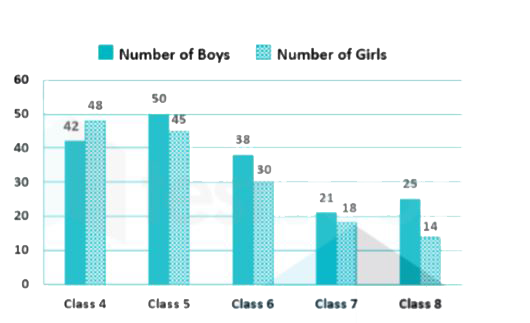
What is the ratio between total number of students in class 4 and number of boys in Class 6 and 7 together?
View SolutionThe Bar graph given below presents the number of books sold by a bookseller during different months of a year.
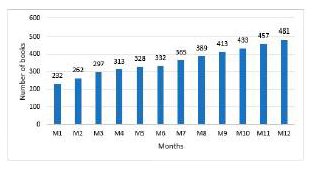
What is the total number of books sold by the bookseller in the year?
View SolutionStudy the Pie chart carefully and answer the questions.
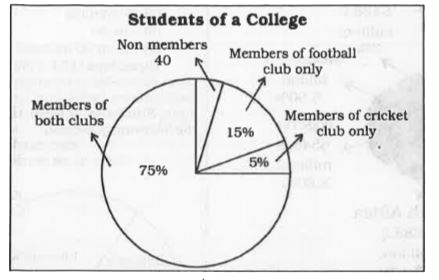
Percentage of students who are not members of any club is :
View Solution
