Study the following table and answer the given questions:
Number of candidates appeared, number of candidates who quallified and respective ratio of number of qualified male and female candidates in entrance exams of different universities
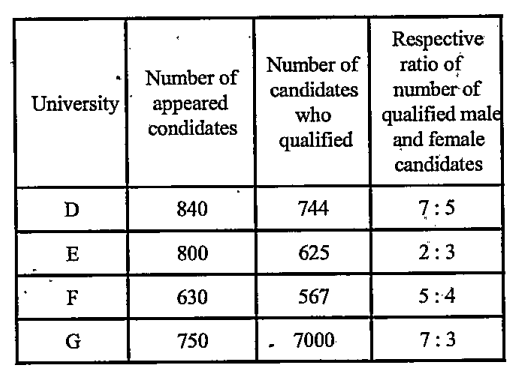
What is the respective ratio between the number of male candidates who qualified in university E’s entrance exam to the number of candidates who did not qualify in university G’s entrance exam?
2:5
2:6
1:5
5:1
The correct Answer is:D
Step by step video, text & image solution for Study the following table and answer the given questions: Number of candidates appeared, number of candidates who quallified and respective ratio of number of qualified male and female candidates in entrance exams of different universities What is the respective ratio between the number of male candidates who qualified in university E’s entrance exam to the number of candidates who did not qualify in university G’s entrance exam? by Maths experts to help you in doubts & scoring excellent marks in Class 14 exams.
Similar Questions
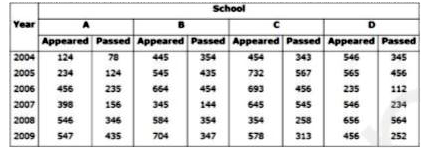
What was the respective ratio between the number of candidates who appeared from school -C in the year 2006 and the number of candidate who passed in the exam from school - D in the year 2009 ?
 View Solution
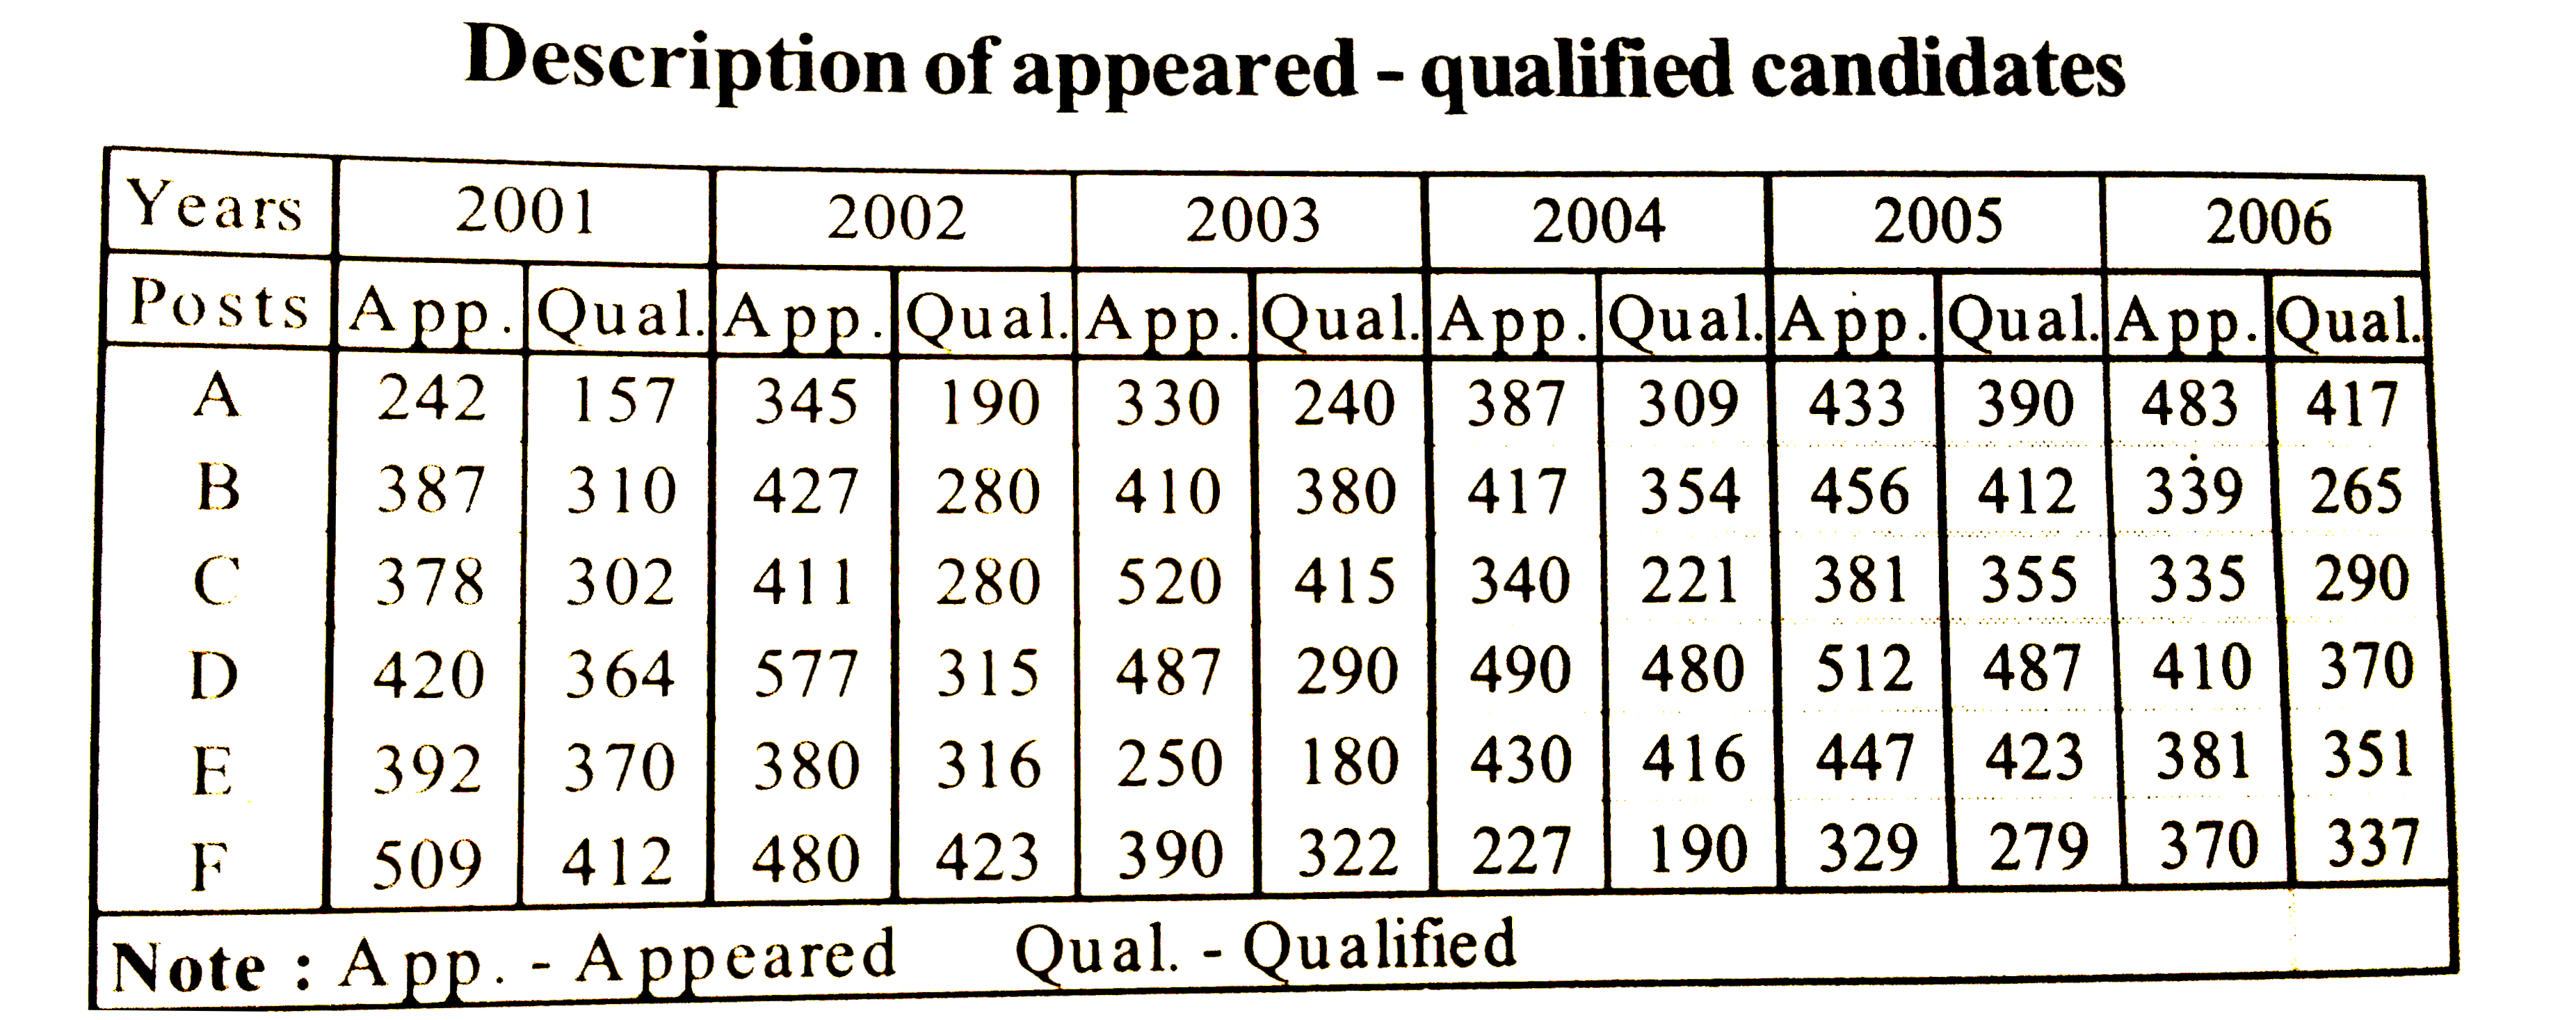
The respective ratio between the number of candidates who qaulified for the posts of A and D in the year 2002 isView Solution
Knowledge Check
- Question 1 - Select One
Study the following table and answer the questions.
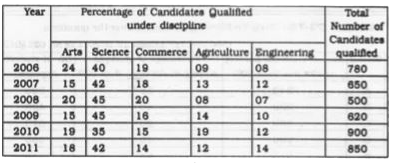
The decrease in the number of candidates qualified under Arts discipline from 2010 to 2011 wasA11B18C42D69 - Question 2 - Select One
Study the following table and answer questions:
Number of candidates appeared in an examination from five cities:
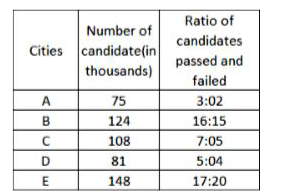
The number of cities, in which pass percentage of candidates is more than 55%, is:A3B2C4D1 - Question 3 - Select One
Direction: The following table represents the number of candidates that appeared and qualified in a competitive examination from different states over five years. Study the table and answer the questions that follow.
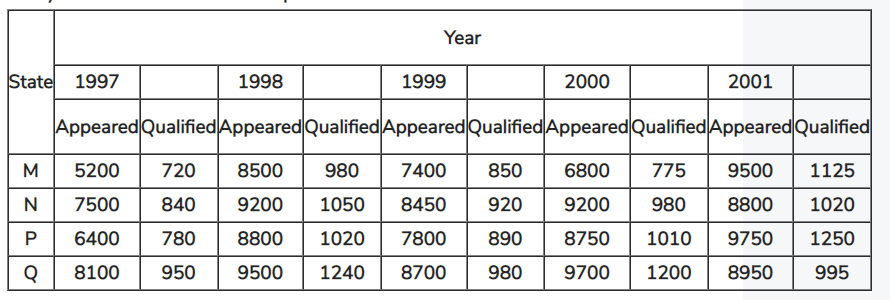
What is the difference between the number of candidates qualifying in the year 1998, in the states M and P?A44B60C50D40
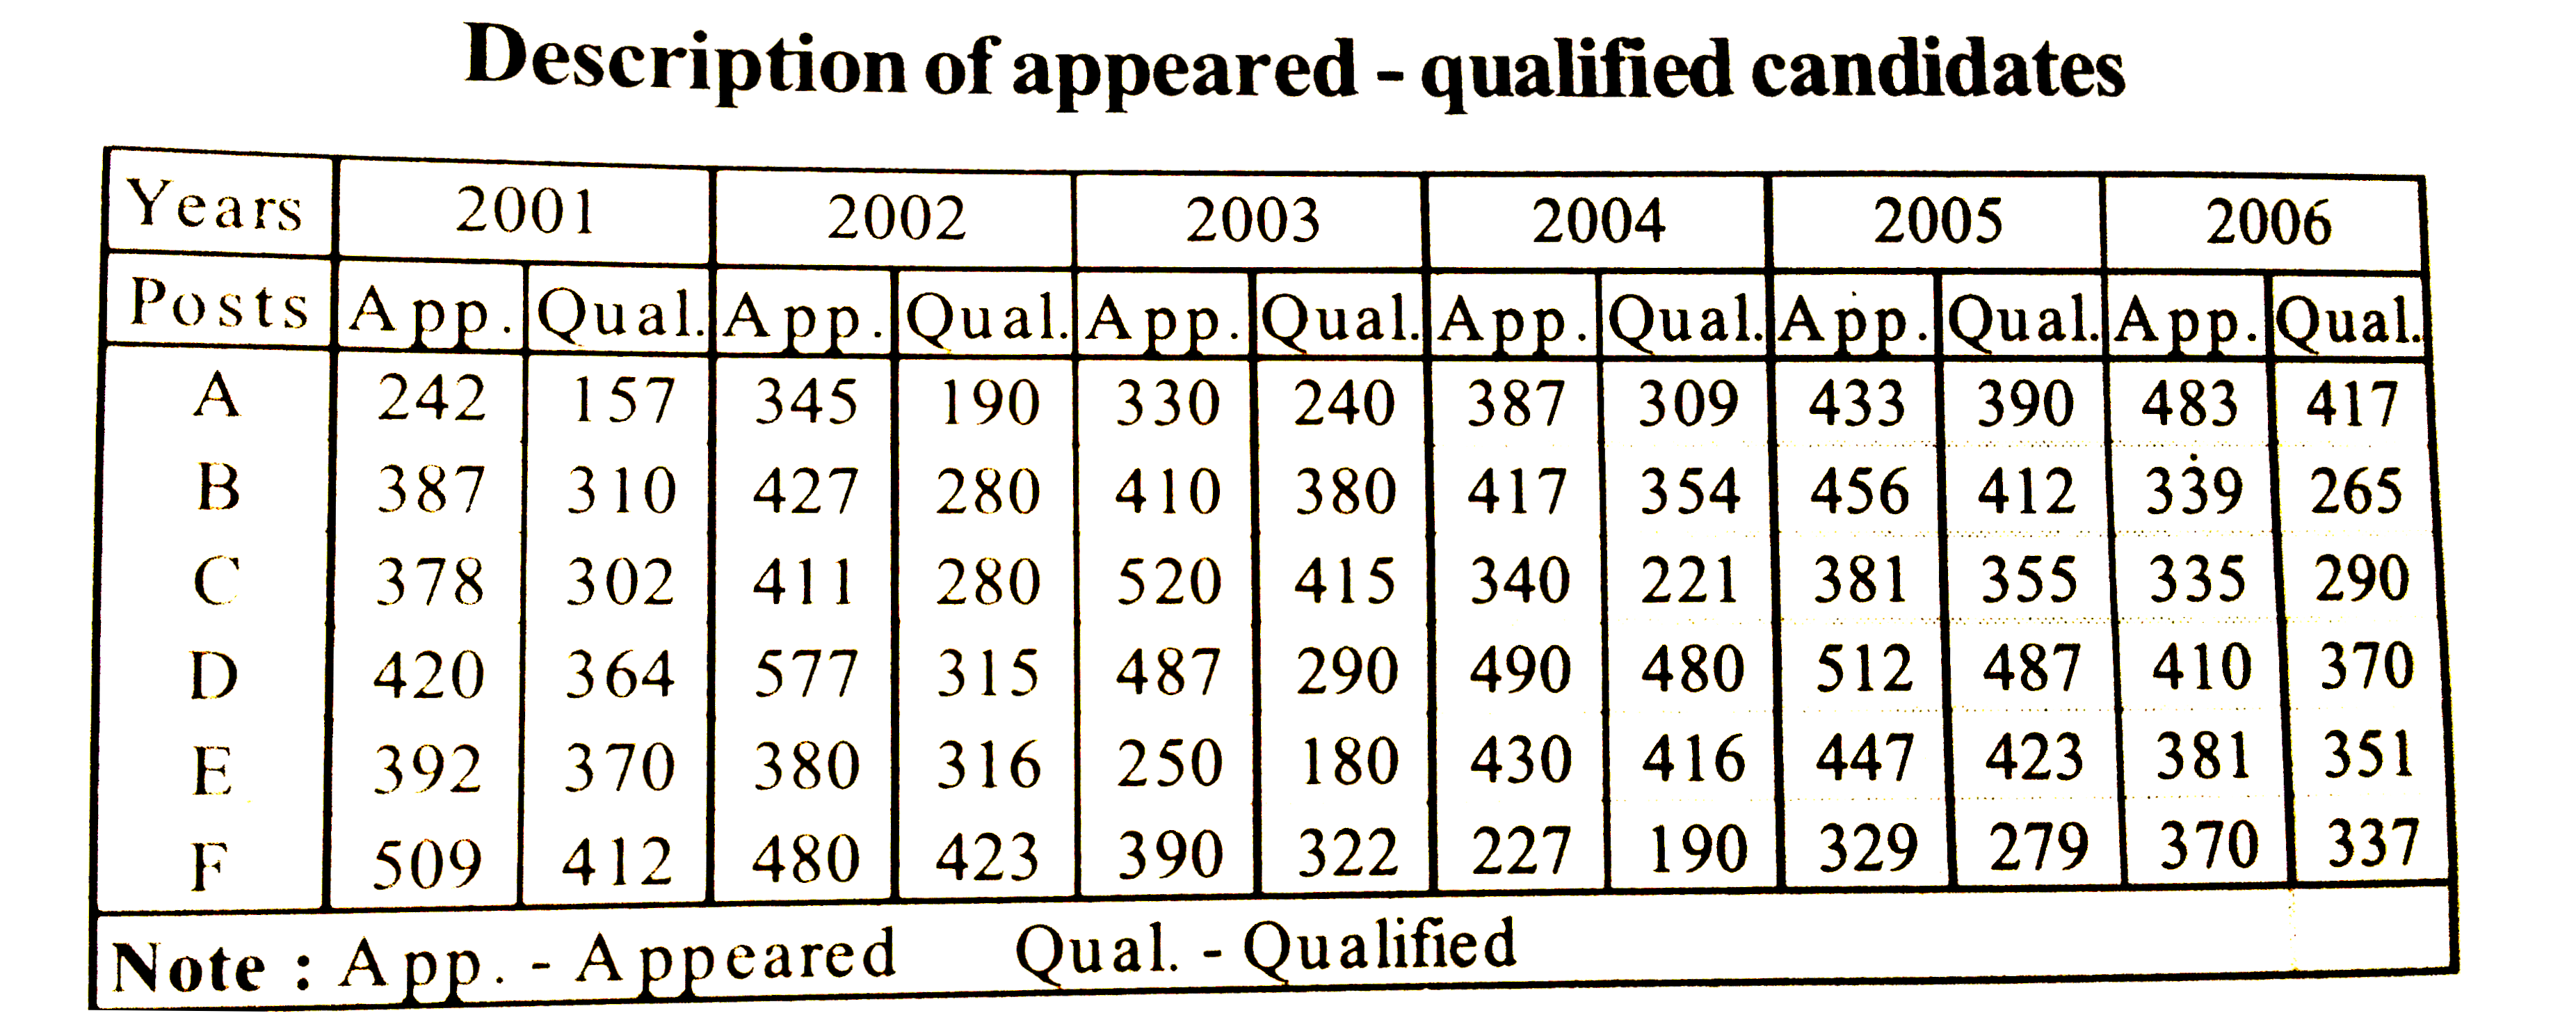
The average number of candidates who qualified for all the posts in the year 2004 isView Solution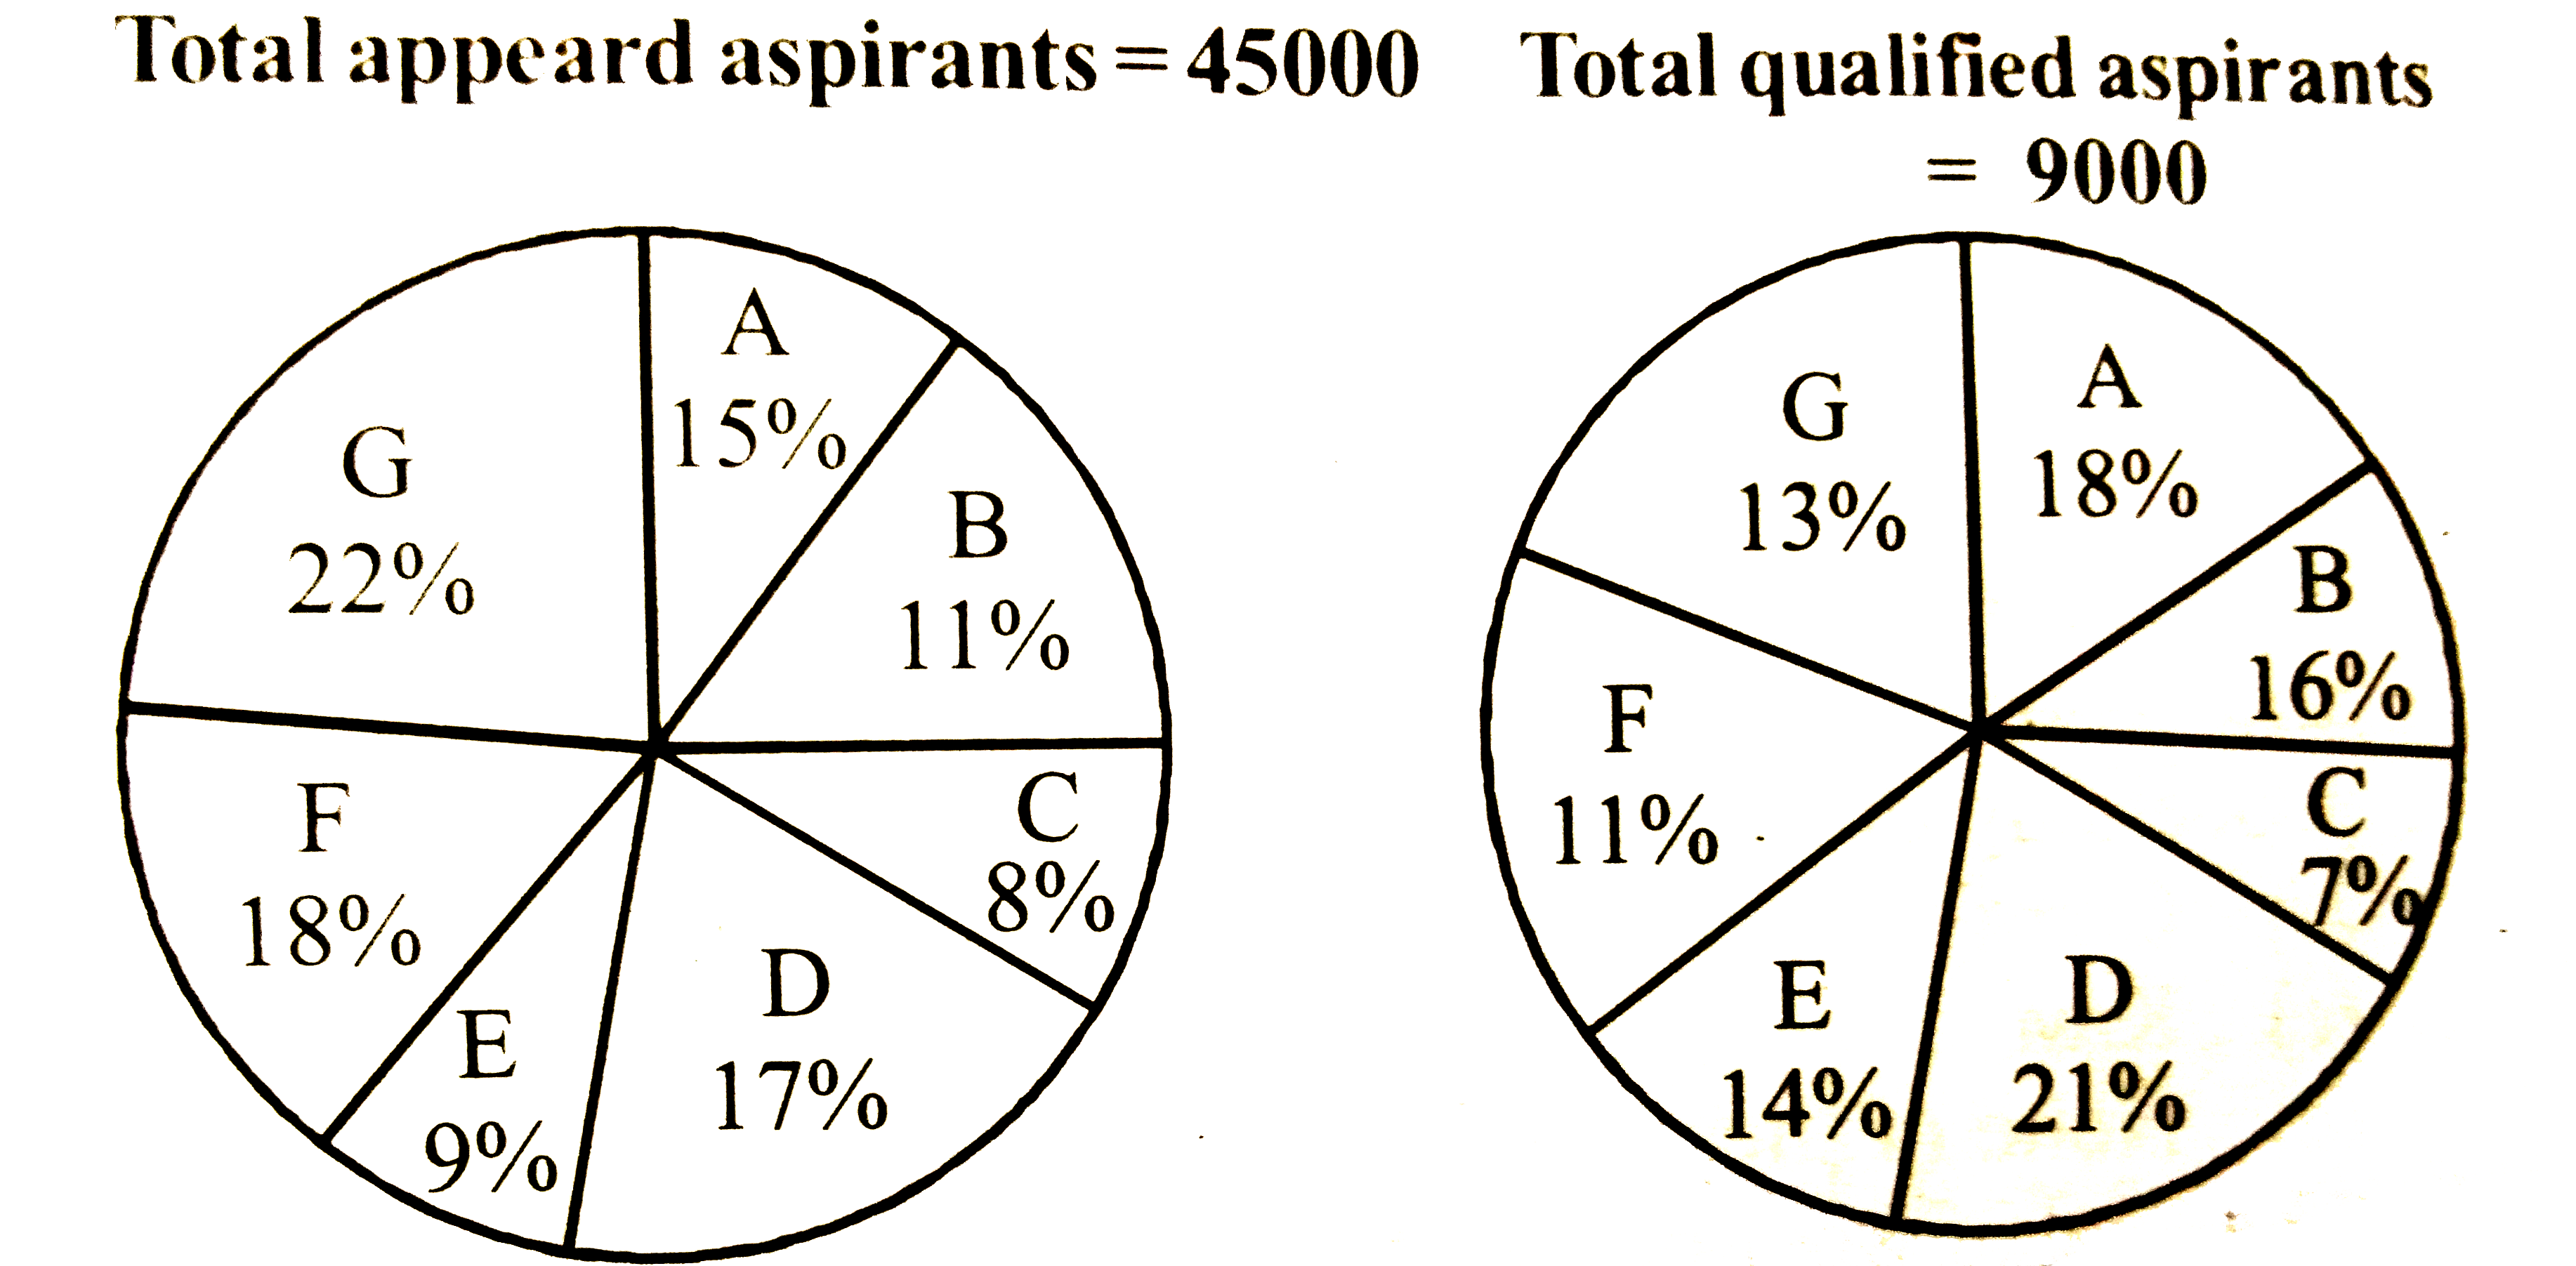
What is the ratio between number of candidates qualified from States B and D together and the number of candidats appeard from States 'C' respectivey ?View SolutionWhat is the respective ratio of the numbers of candidates failing in the exam from city D to those failing in the exam from city A?
View SolutionStudy the following table and answer questions:
Number of candidates appeared in an examination from five cities:
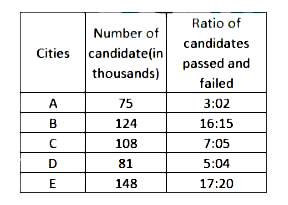
The ratio of the total number of candidates who passed from cities A and C to that who failed in cities B and E is:View SolutionStudy the following graph carefully and answer the question given below
Number of candidates appeared (in thousand) and percentage of candidates qualified in a competitive examination over the years.
No. of candidates appeared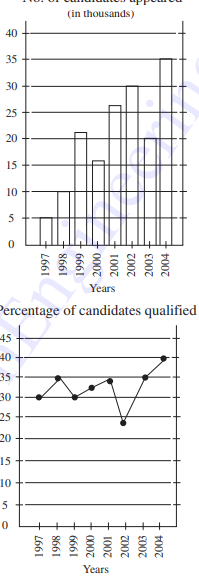
What was the ratio between the number of candidates appeared in 1997 and the number of candidates qualified in 2004?View Solution
