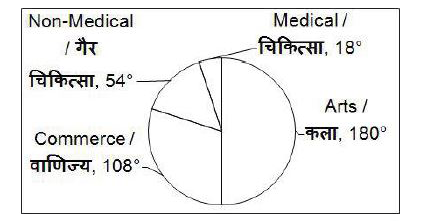
The given pie chart shows the stream wise distribution (in degrees) of the candidates who applied for an entrance exam. The total number of candidates who applied was 720000 and out of which 5400 have qualified the exam
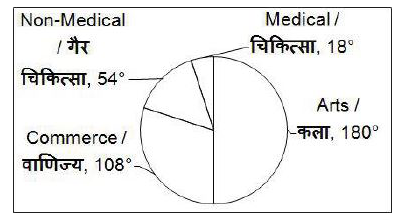
What is the respective ratio of the Arts candidates and Commerce candidates?
3:1
2:1
5:3
7:5
The correct Answer is:C
Step by step video, text & image solution for The given pie chart shows the stream wise distribution (in degrees) of the candidates who applied for an entrance exam. The total number of candidates who applied was 720000 and out of which 5400 have qualified the exam What is the respective ratio of the Arts candidates and Commerce candidates? by Maths experts to help you in doubts & scoring excellent marks in Class 14 exams.
Updated on:21/07/2023Similar Questions
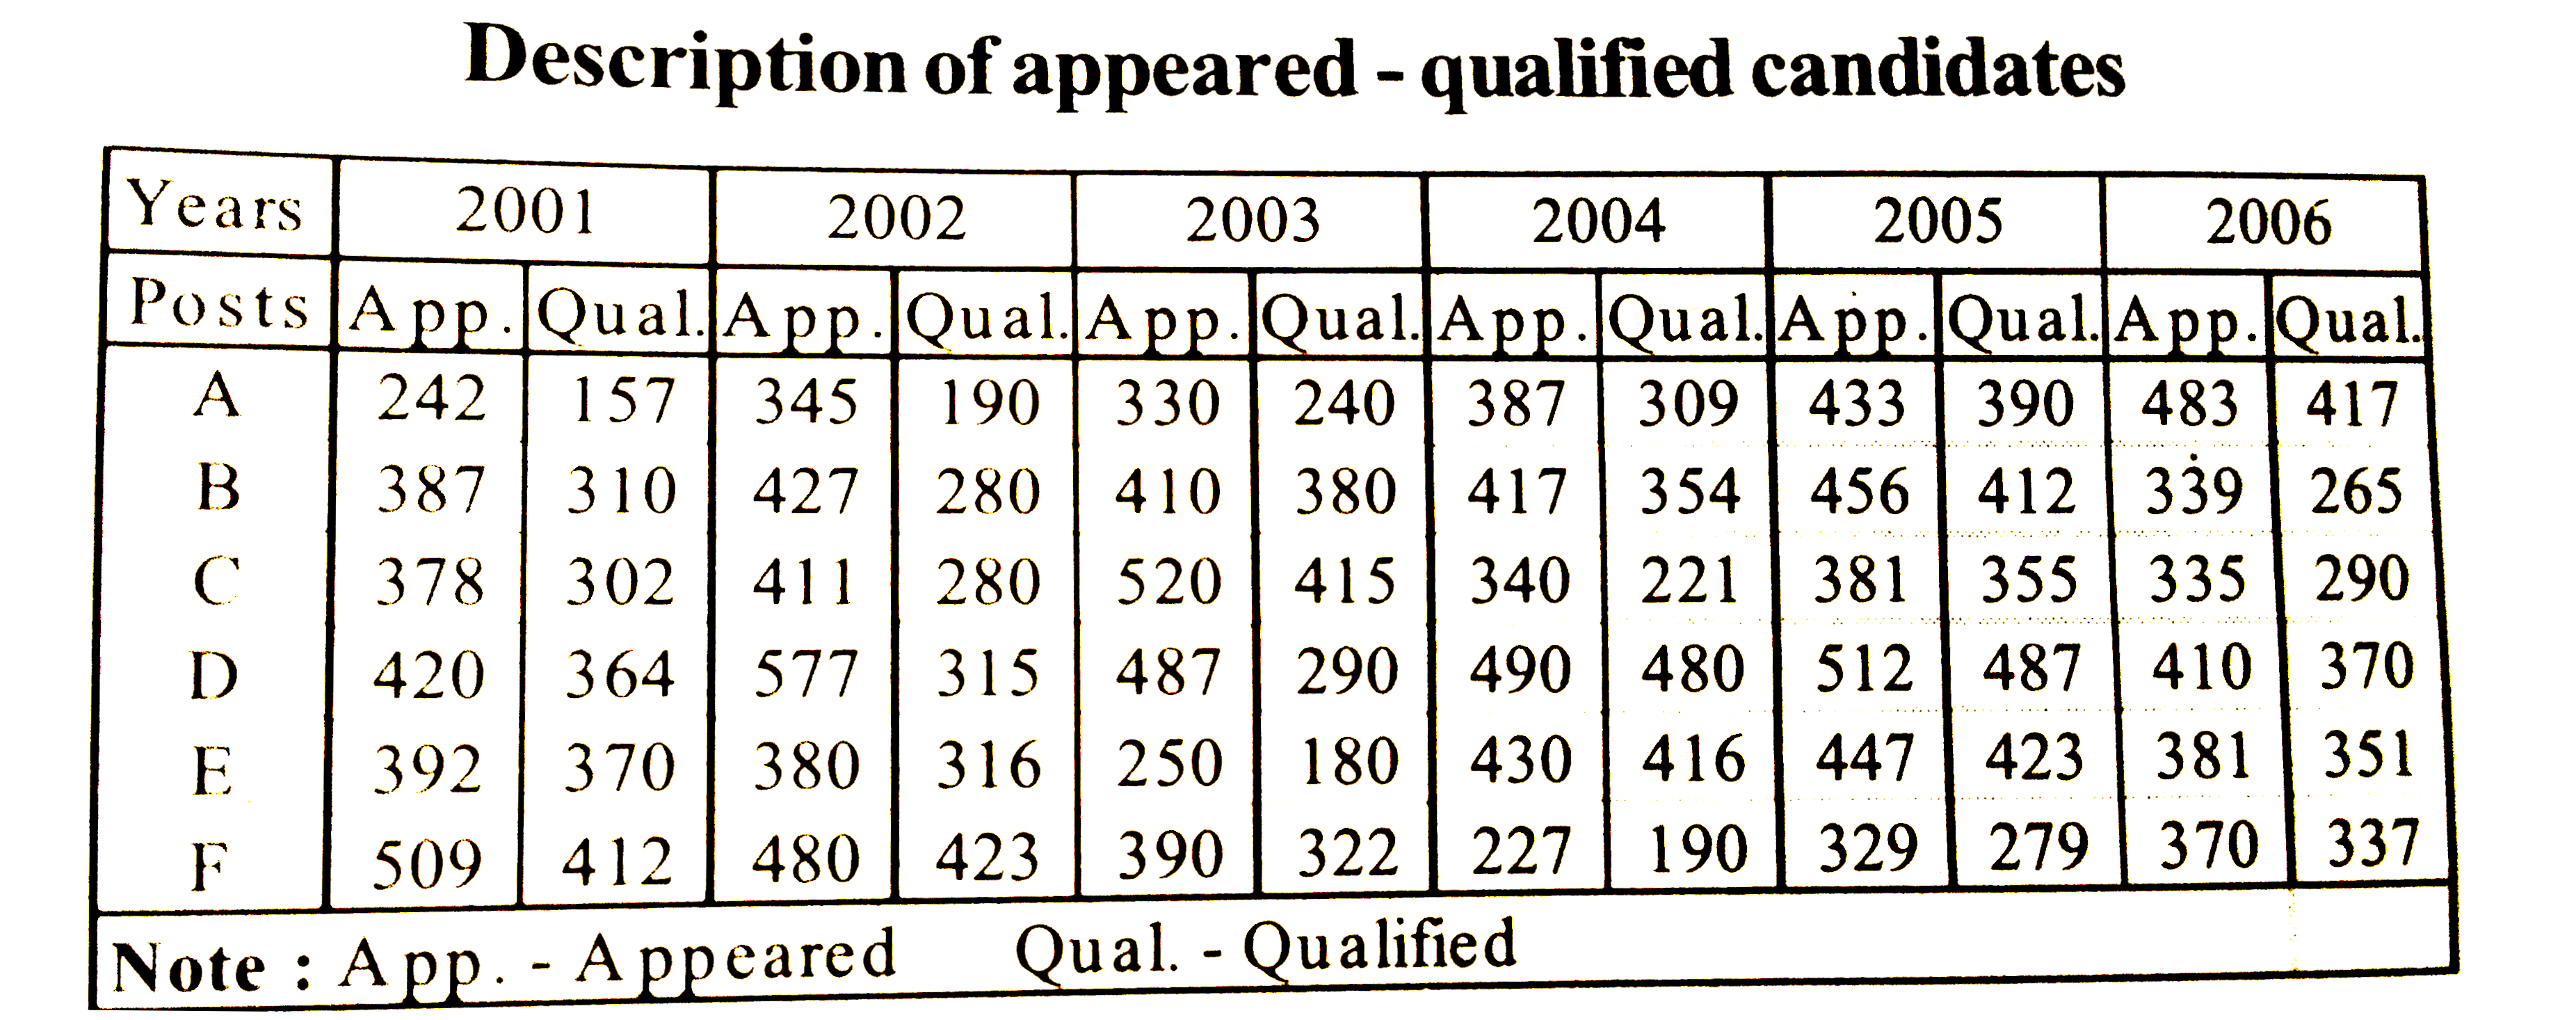
What is the approximate average number of candidates who qualified for all the posts in the year 2002?
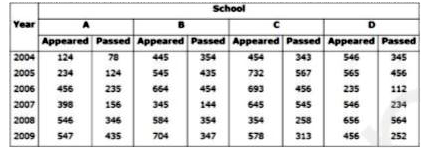
View SolutionWhat was the respective ratio between the number of candidates who appeared from school -C in the year 2006 and the number of candidate who passed in the exam from school - D in the year 2009 ?
View Solution
Knowledge Check
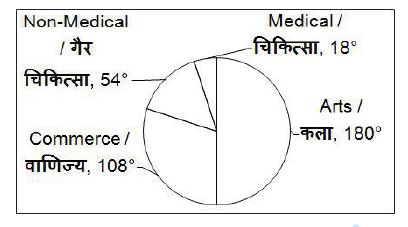
The given pie chart shows the stream wise distribution (in degrees) of the candidates who applied for an entrance exam. The total number of candidates who applied was 720000 and out of which 5400 have qualified the exam
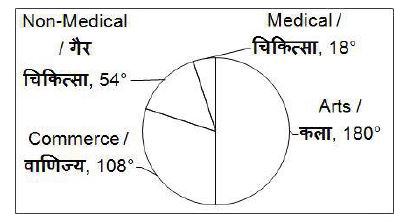
What is the average of the total candidates from Arts, Commerce and Non-medical?A216000B296000C260000D228000The given pie chart shows the stream wise distribution (in degrees) of the candidates who applied for an entrance exam. The total number of candidates who applied was 720000 and out of which 5400 have qualified the exam
What percentage of the total candidates belong the non-medical?A18%B8.33%C15%D14.28%The given pie chart shows the stream wise distribution (in degrees) of the candidates who applied for an entrance exam. The total number of candidates who applied was 720000 and out of which 5400 have qualified the exam
What percentage of the total candidates who applied for the exams have qualified it?A0.85B0.75C0.6D0.8
Number of candidates passing the exam from city F is what percent of the total number of candidates appearing from all the cities together?
View SolutionThe given pie chart shows the stream wise distribution (in degrees) of the candidates who applied for an entrance exam. The total number of candidates who applied was 720000 and out of which 5400 have qualified the exam
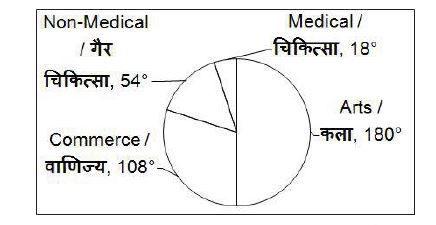
If from medical and non-medical both, 1.3% candidates have qualified the exam, then how many candidates have qualified the exam from commerce and arts in total?
View SolutionThese questions are based on the following graphs :
Details of statewise distribution of candidates appeard in an examination.
Total appeared candidates = 1,00,000
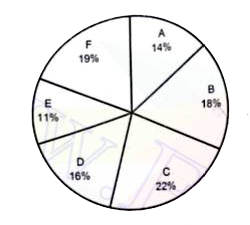
Ratio of Male and female candidates appeared
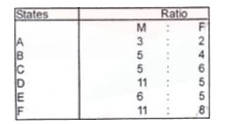
What is the respective ratio of the number of male candidates appeared in the examination from state A to that from state E ?
View SolutionWhat is the average number of candidates appearing for the entrance exam from state D in the years 2007, 2008 and 2009 together?
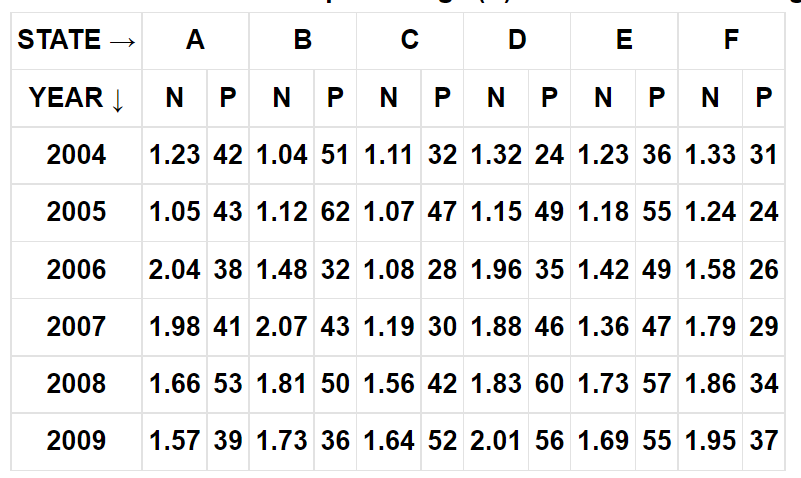
View SolutionStudy the following table carefully and answer the questions given below it. Number of candidates appearing for an interview for a post in Bank and percentage of candidates qualifying
Figure
What was the respective ratio of the number of candidates who qualified in bank A to the number of candidates who qualified in bank E?
View Solution
