Refer to the graph and answer the given questions
Data regarding the number of students opting for one of the five games at a Sports Academy (having a total strength of 1400 students)

What is the average, number of students opting for Cricket, Swimming and Volleyball in2013?
300
320
290
310
The correct Answer is:A
Step by step video, text & image solution for Refer to the graph and answer the given questions Data regarding the number of students opting for one of the five games at a Sports Academy (having a total strength of 1400 students) What is the average, number of students opting for Cricket, Swimming and Volleyball in2013? by Maths experts to help you in doubts & scoring excellent marks in Class 14 exams.
Updated on:21/07/2023Similar Questions
The pie chart given below show the number of students who like the five beverages Pepsi, coke Fanta , Frooti and Dew . The total number of students is 540 .
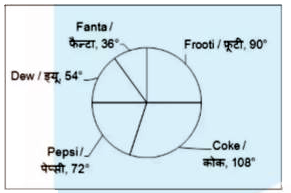
What is the average number of students who likes Coke and Pepsi?
View SolutionThe pie chart given below shows the number of students who play five sports like Hockey, Tennis Cricket, Golf and Polo. The total number of students is 1080.
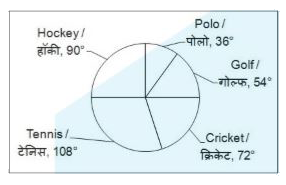
What is the average number of students playing Tennis and Cricket?
View Solution
Knowledge Check
the pie chart given below shows the distribution of students who like the given 5 sports. . The total number of students is 960.
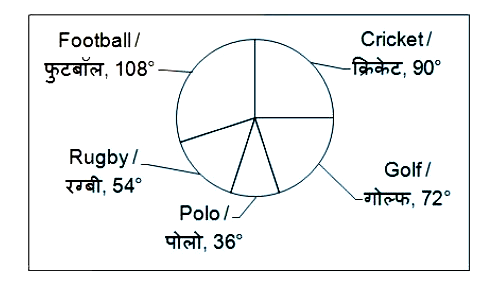
What is the average number of students who like Golf and Cricket?A240B432C192D216The given pie-chart represtns the percentage of students enrolled in five different sports. The total number of students is 2800.

What is the average number of students enrolled in Hockey and Tennis together?A560B580C540D460The given pie-chart represents the percentage of students enrolled in five different sports. The total number of students is 2800.
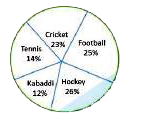
What is the average number of student enrolled in Hockey and Tennis together ?A560B580C540D460
The pie chart given below sows the number of students in 6 different sections. The total number of students is 1800.
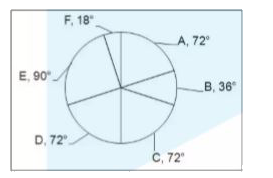
What is the average number of students in section A, B and F?
View SolutionStudy the double bar graph given below and answer the questions.
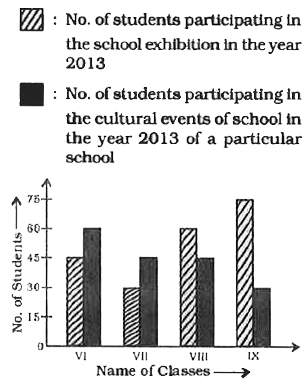
The average of the number of students participating in cultural events is
View SolutionStudy the double bar graph given below and answer the questions.
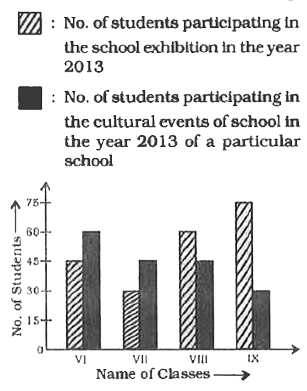
The average of the number of students participating in exhibition is
View SolutionThe pie-chart given below shows the number of students who like the five beverages Pepsi, Coke, Fanta, Frooti and Dew. The total number of students is 540.
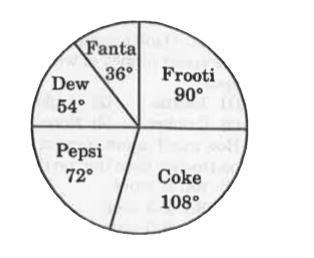
What is the total number of students who like Frooti and Pepsi?
View SolutionIf in the pie chart representing the number of students opting for different streams of study out of a total strength of 1650 students , the central angle of the sector representing arts students is 48∘ then what is the number of students who opted for arts stream ?
View Solution
