Study the table and answer the given questions
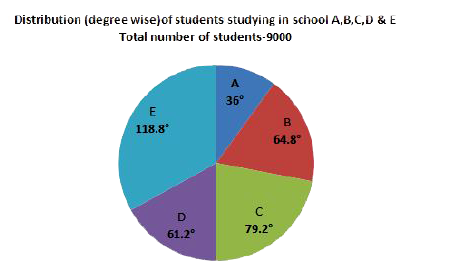
Data regarding number of students who appeared, for a givan test from five school-A,B,C,D and E
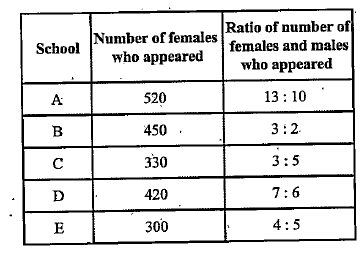
Total number of students (males and females) appearing from School D was by what per cent more than those from School E?
1489
1559
1819
1779
The correct Answer is:B
Step by step video, text & image solution for Study the table and answer the given questions Data regarding number of students who appeared, for a givan test from five school-A,B,C,D and E Total number of students (males and females) appearing from School D was by what per cent more than those from School E? by Maths experts to help you in doubts & scoring excellent marks in Class 14 exams.
Updated on:21/07/2023Similar Questions
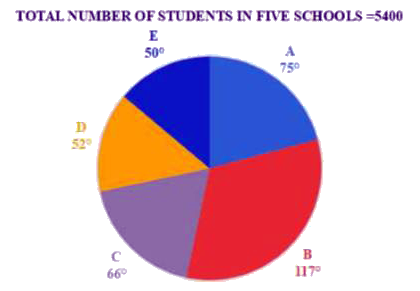
Study the given pie chart and answer the question that follows
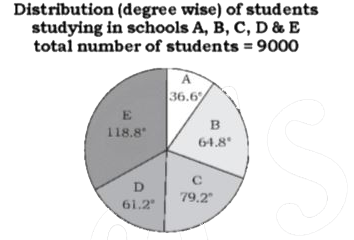
The total number of students in schools D and E is what percentage more than the number of students in schools B and C?
View SolutionDirections (Questions 16-20): Study the following graph carefully and answer the questions given below: Total Number of Students Appeared and Qualified from Various Schools at a Scholarship Exam (FIGURE) The average number of students qualified in the examination from Schools C and D is what percent of the average number of students appeared for the examination from the same schools? (rounded off to 2 digits after decimal) (a) 58.62 (b) 73.91 (c) 62.58 (d) 58.96 (e) None of these
View Solution
Knowledge Check
Study the following table and answer question.
Number of students appeared in an examination from five citie s:
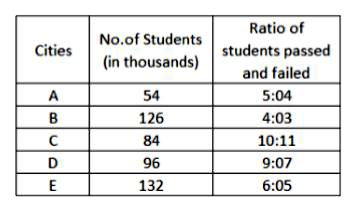
The total number of students who appeared in the examination from cities C and D is what percent more than the total number of students who failed in cities A, B and E ? (nearest to an integer)A44B30C41D42Study the following table and answer question.
Number of students appeared in an examination from five cities :
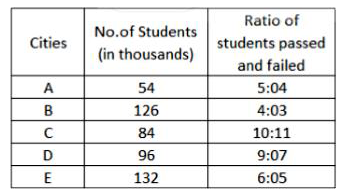
The ratio of the total number of students passed in the examination from cities A and D to that of students failed from cities B and E ?A9:16B5:9C13:18D14:19Study the given pie chart and answer the question that follows.
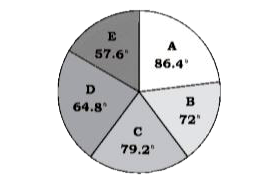
Break-up of the students studying in schools A,B,C,D and E managed by a society, in 2019
The average number of students in schools A,B and C is what percentage more than the number of students in school E ?A65%B60%C72%D70%
Study the given pie chart and answer the question that follows
If the total number of students in schools D and E exceeds the number of students in school by x, then x lies between
View SolutionIn an examination the percentage of students qualified to the number of students appeared from school A is 70%. In school B, the number of students appeared is 20% more than the student appeared from school A and the number of students qualified from school B is 50% more than the students qualified from school A. What is the percentage of students qualified to the number of students appeared from school B? 30% b. 70% c. 78.5% d. 87.5%
View SolutionStudy the following graph carefully to answer the questions.
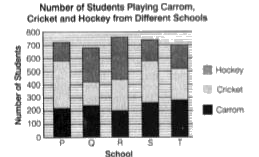
Total number of students playing Carrom and Hockey together from school P is what per cent of the total number of students playing these two games together from school R ?
View SolutionStudy the given pie chart and answer the question that follows.
Break-up (degree-wise) of the number of students in five schools (A, B, C, D and E) in a city.
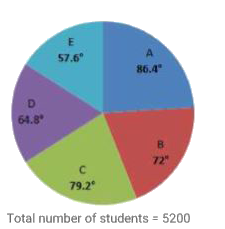
If the total number of students in schools D and E exceeds the number of students in school A by x, then x lies between:
View SolutionStudy the given pie chart and ansewr the question that follows .
The number of students in school E exceeds the total number of students in schools A and B by x, where x lies between :
View Solution
