Refer to the graph and answer the given questions.
Number of students who opted for 2 courses A and B from 2010 to 2014
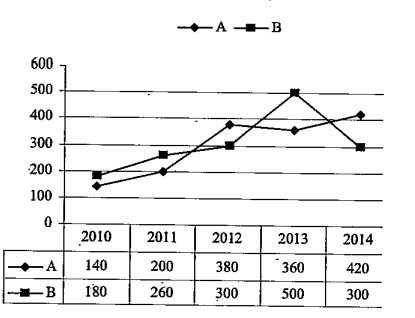
The number of students who opted for Course B in 2013 was what per cent more than that who opted for course A in 2013?
45'16
42'49
38'89
56'79
The correct Answer is:C
Step by step video, text & image solution for Refer to the graph and answer the given questions. Number of students who opted for 2 courses A and B from 2010 to 2014 The number of students who opted for Course B in 2013 was what per cent more than that who opted for course A in 2013? by Maths experts to help you in doubts & scoring excellent marks in Class 14 exams.
Updated on:21/07/2023Similar Questions
Knowledge Check
In the IGNOU (Indira Gandhi National Open University) there are total 16,000 students pursuing MBA, which offers the specialization only in Finance, HR and Marketing IGNOU accepts only Science, Commerce and Engineering Students for the two years course of MBA. The number of science. students is 166.66% of the Commerce students. Number of Engineering students is equal to the number of Science and Commerce students together. Each student can specialize in only one of the marketing , HR and Finance, 20% of Science students opted the Finance, which is 16.66% less than the no. of commerce students who opted Finance. The total Finance students is equal to 18% the total strength of the MBA students. 32% of Science students opted HR. Commerce students who opted HR is equal to 25% of total students specializing in Finance and Engineering students equal to 6.5% of the total strength of the MBA students opted HR.
The number of Engineering students who opted marketing is :A7850B7500C8850Dnone of theseThe given Bar graph present the number of students from Science and Arts streams from a school in different years
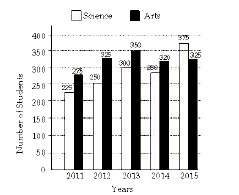
The average number of science students in 2011,2013 and 2015 is what percentage more than the number of Arts students in 2011?A1119%B9311%C9111%D819%
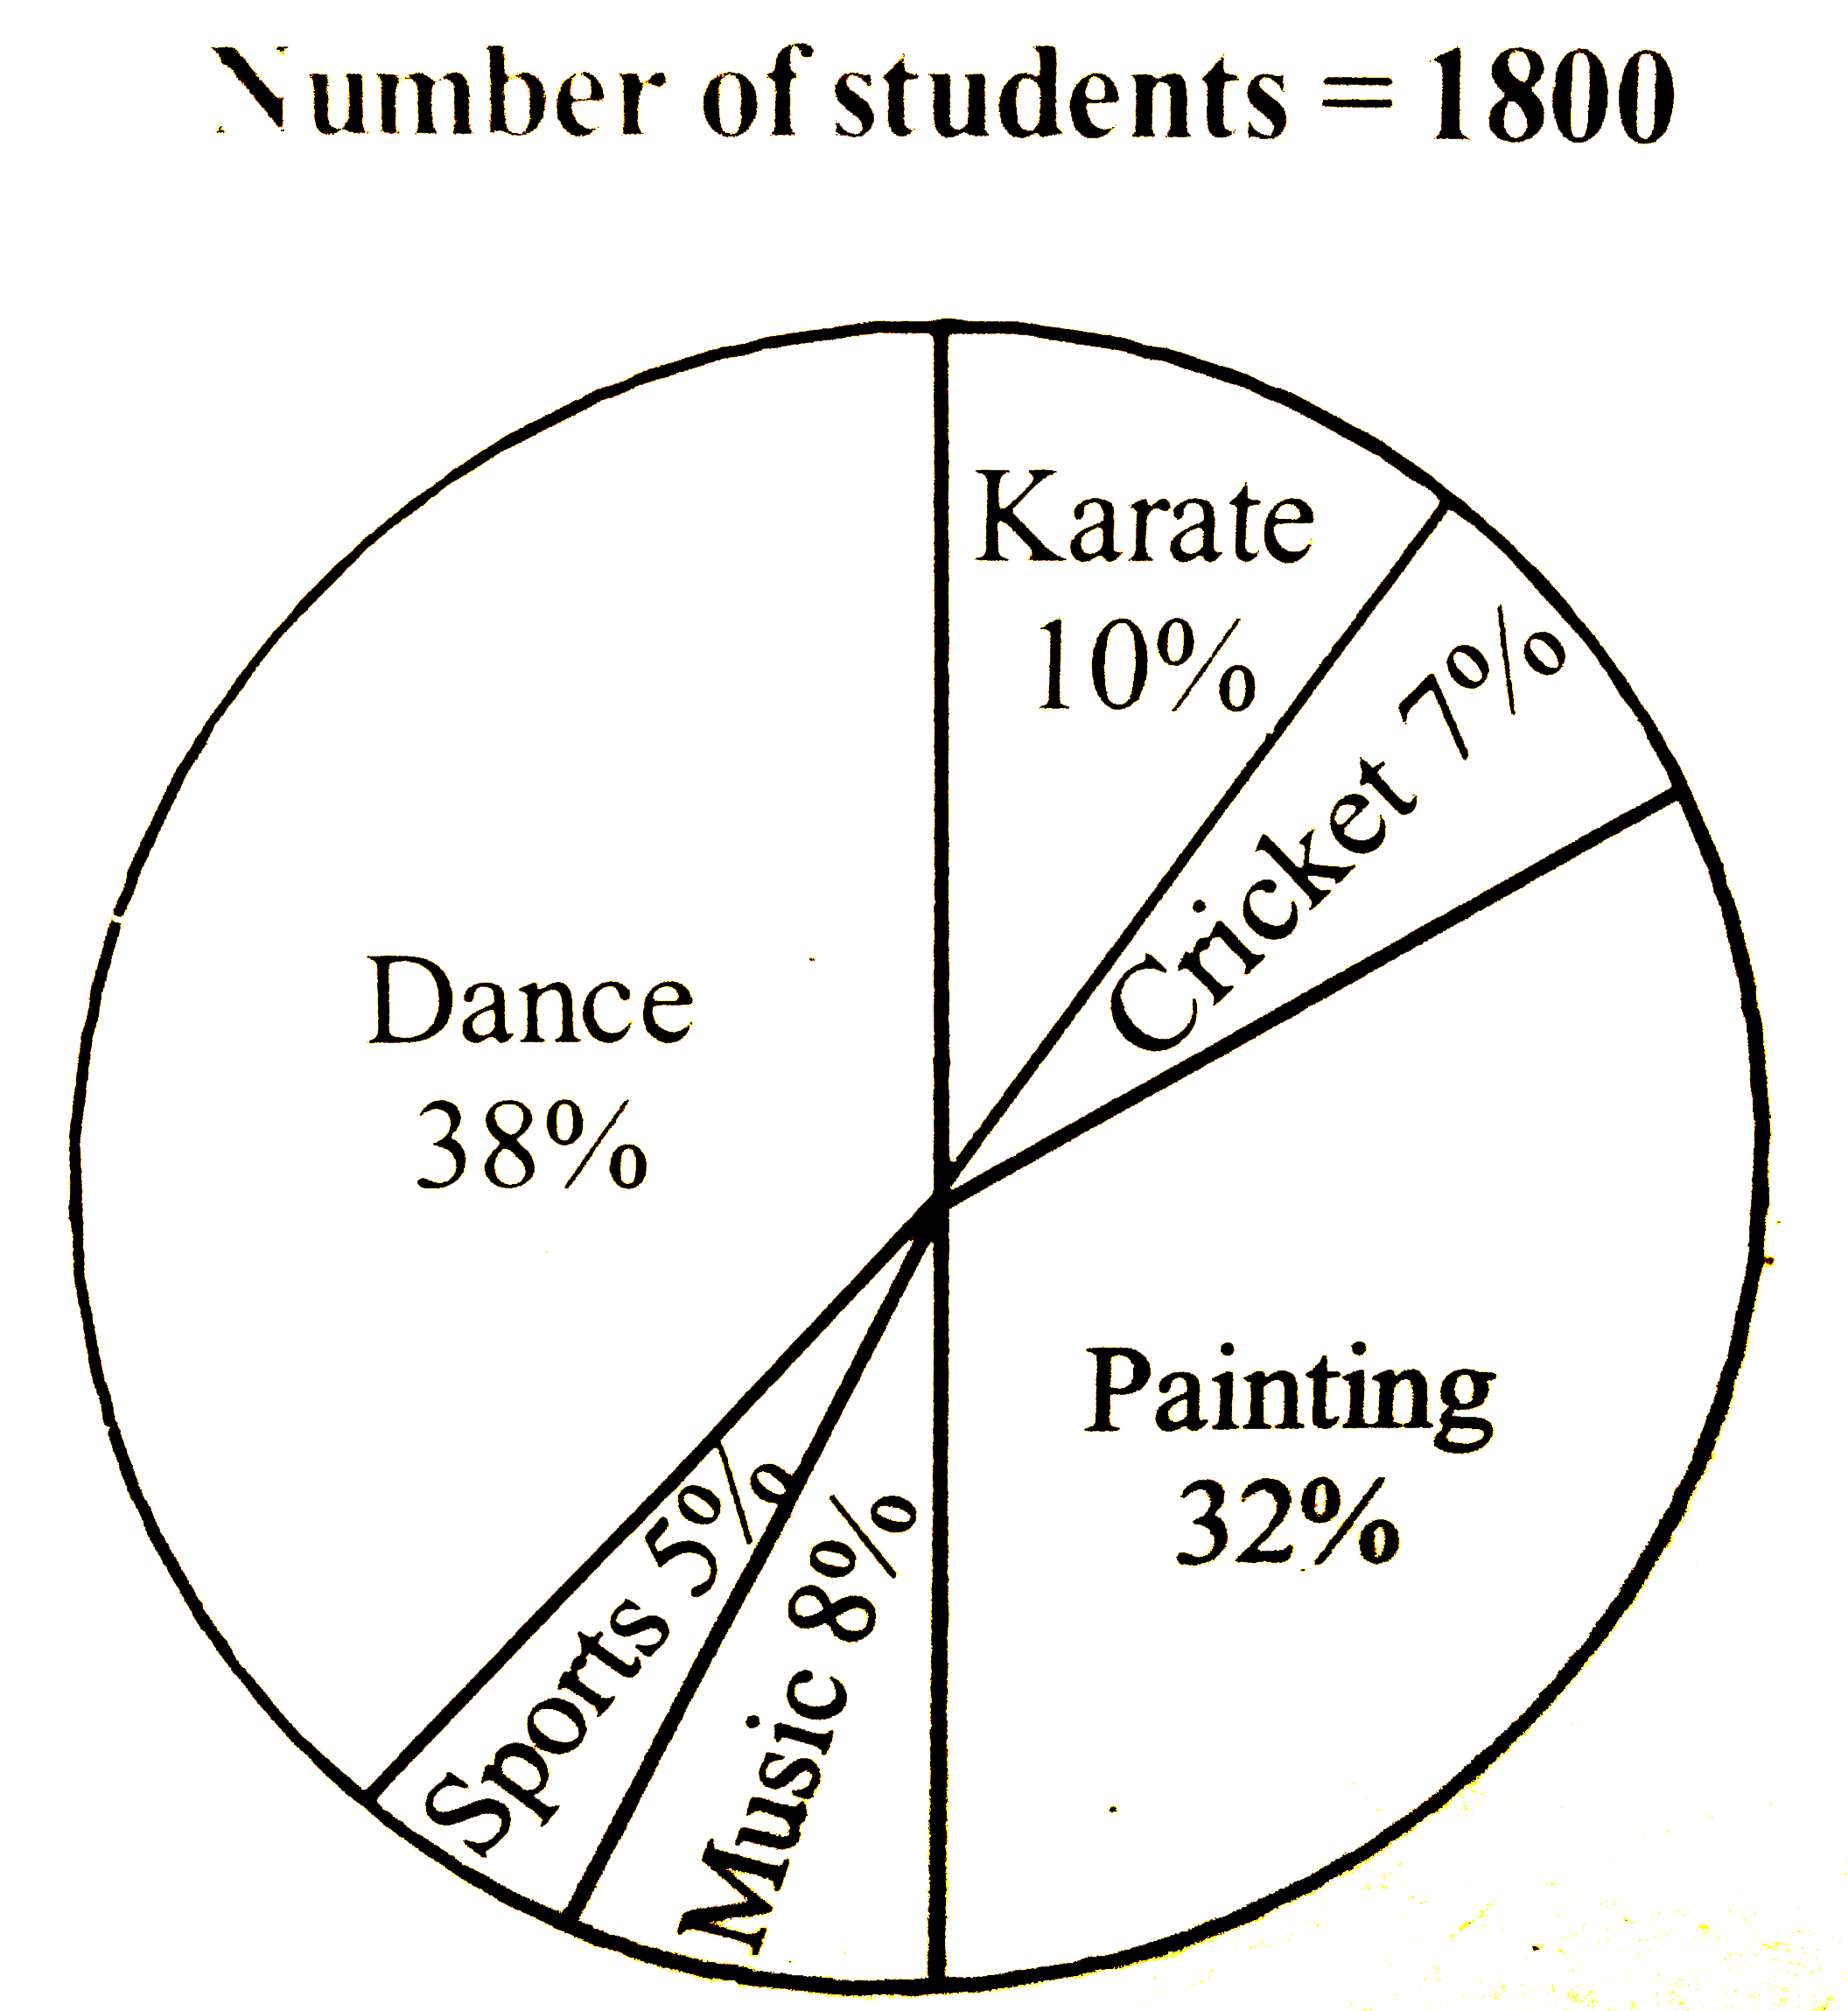
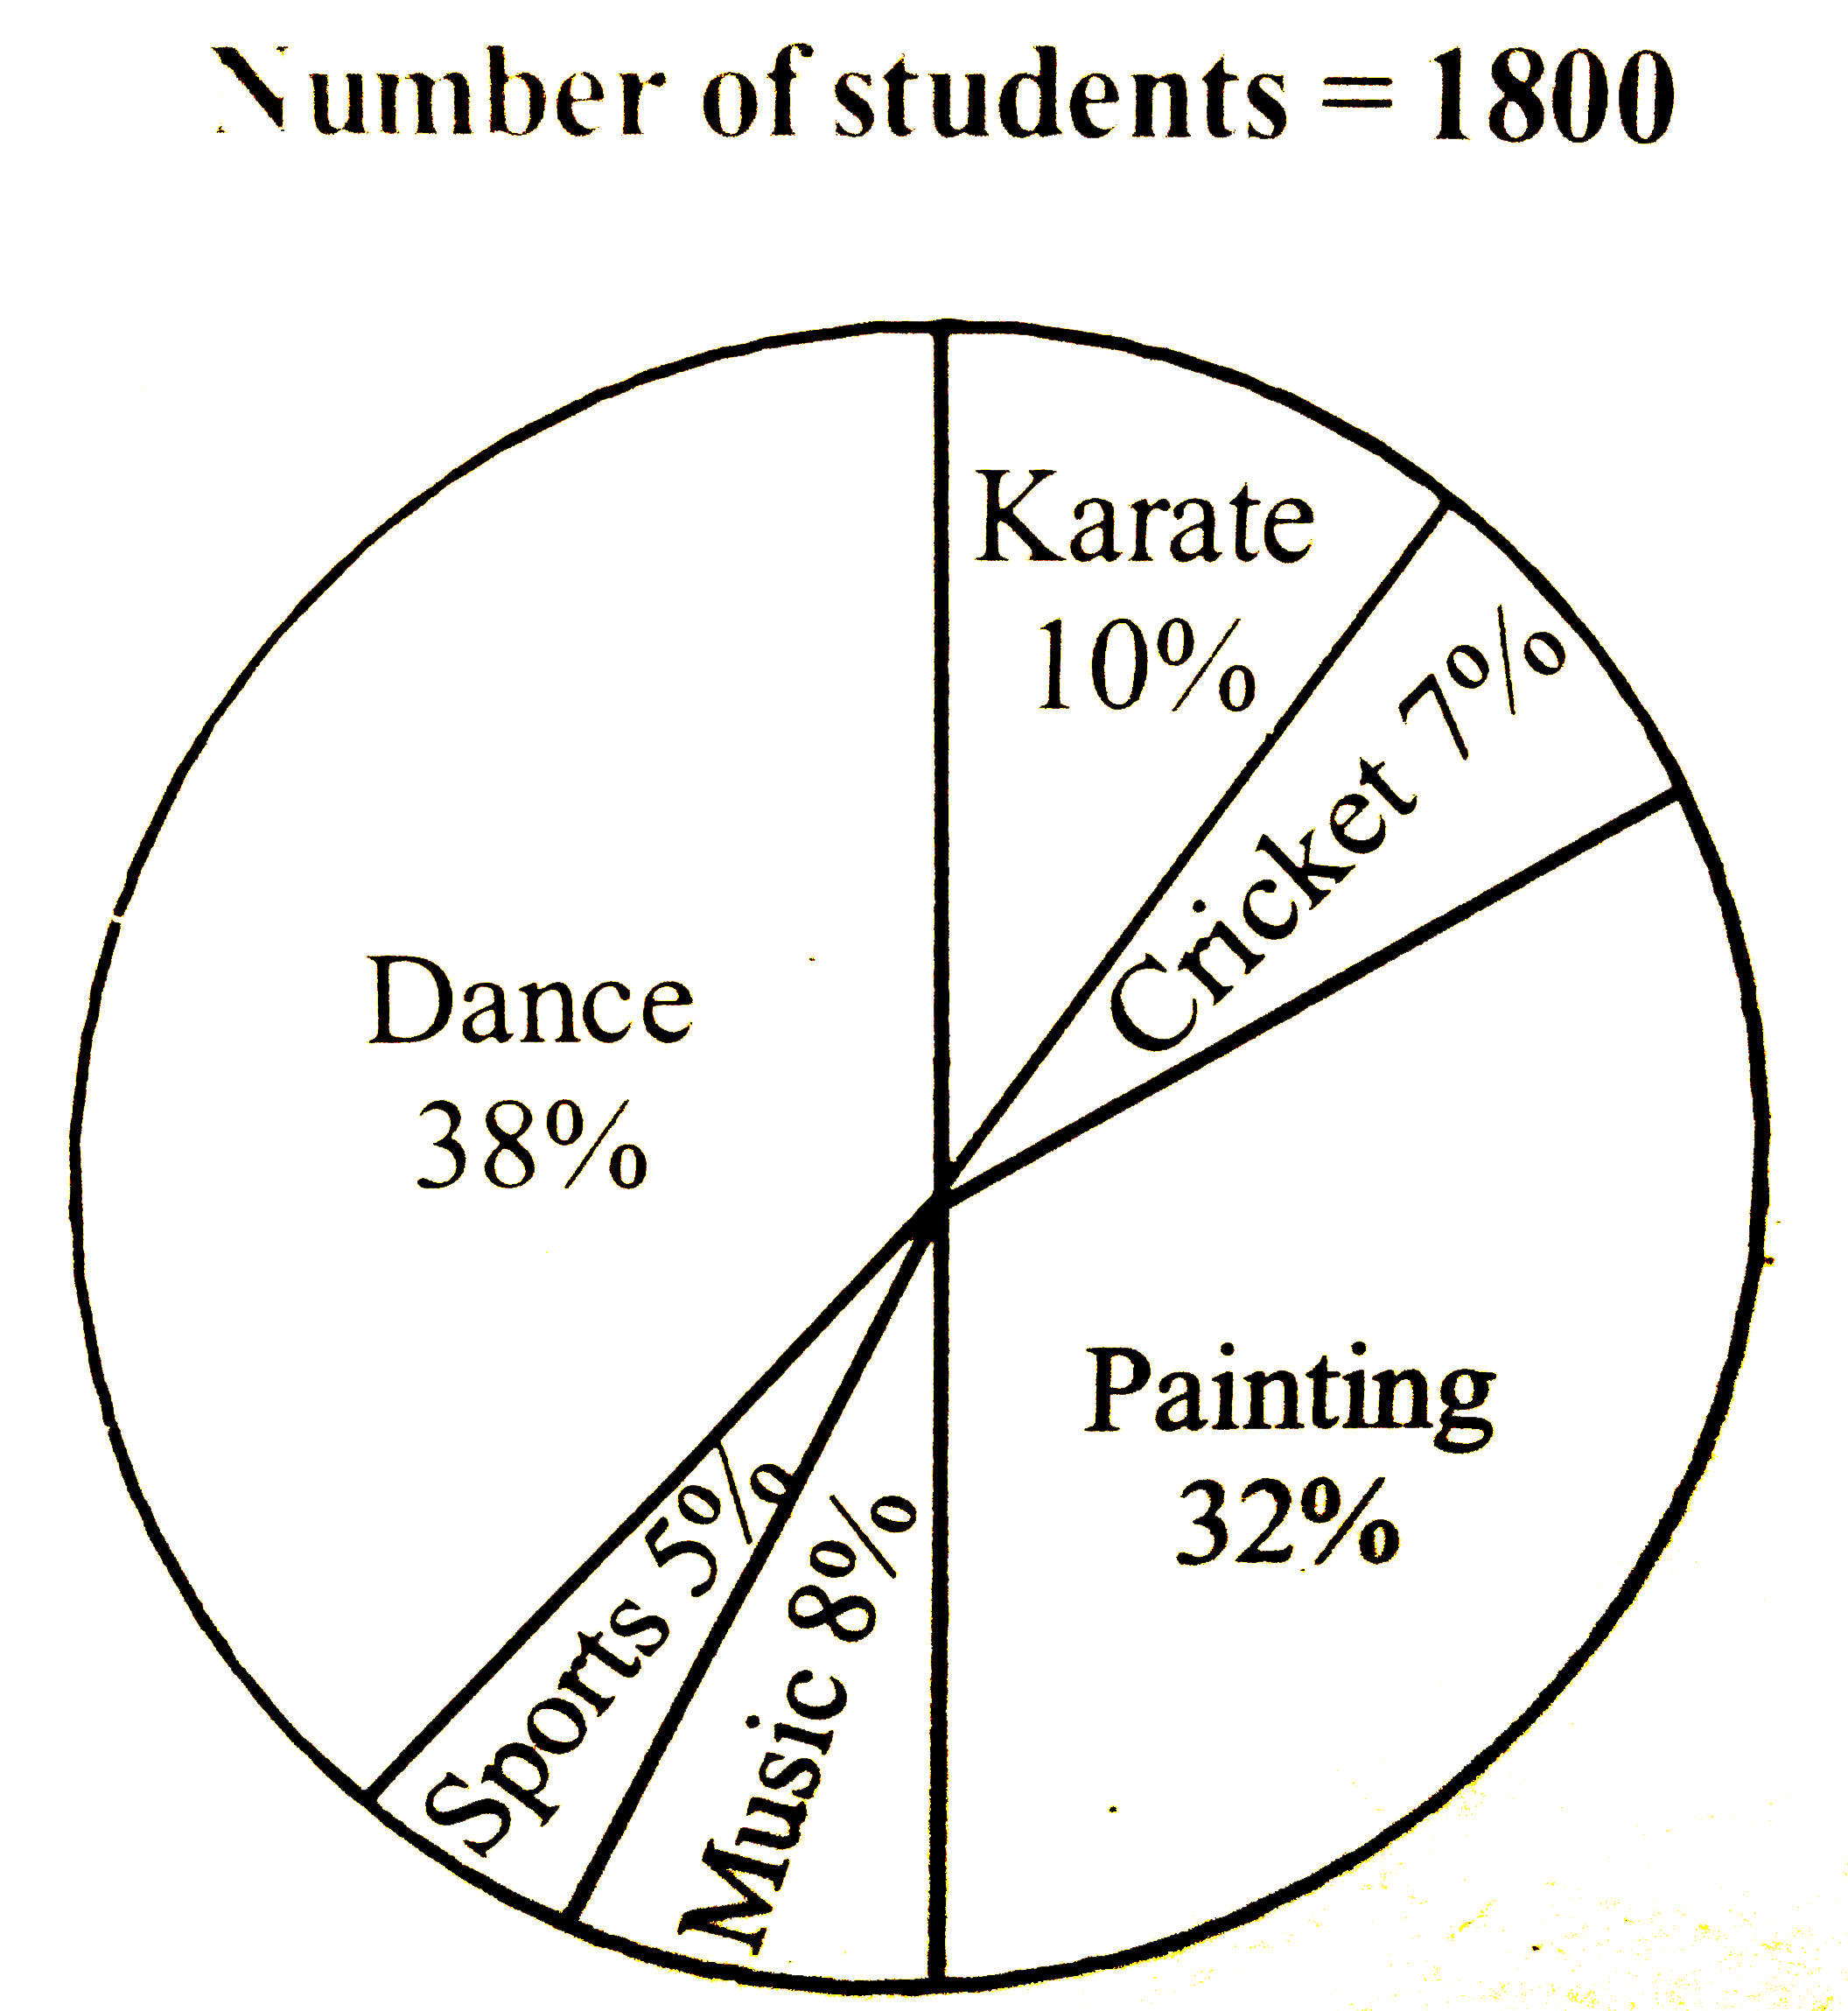
What is the respective ratio between the number of students who opted for painting and that who opted for Karate ?
View Solution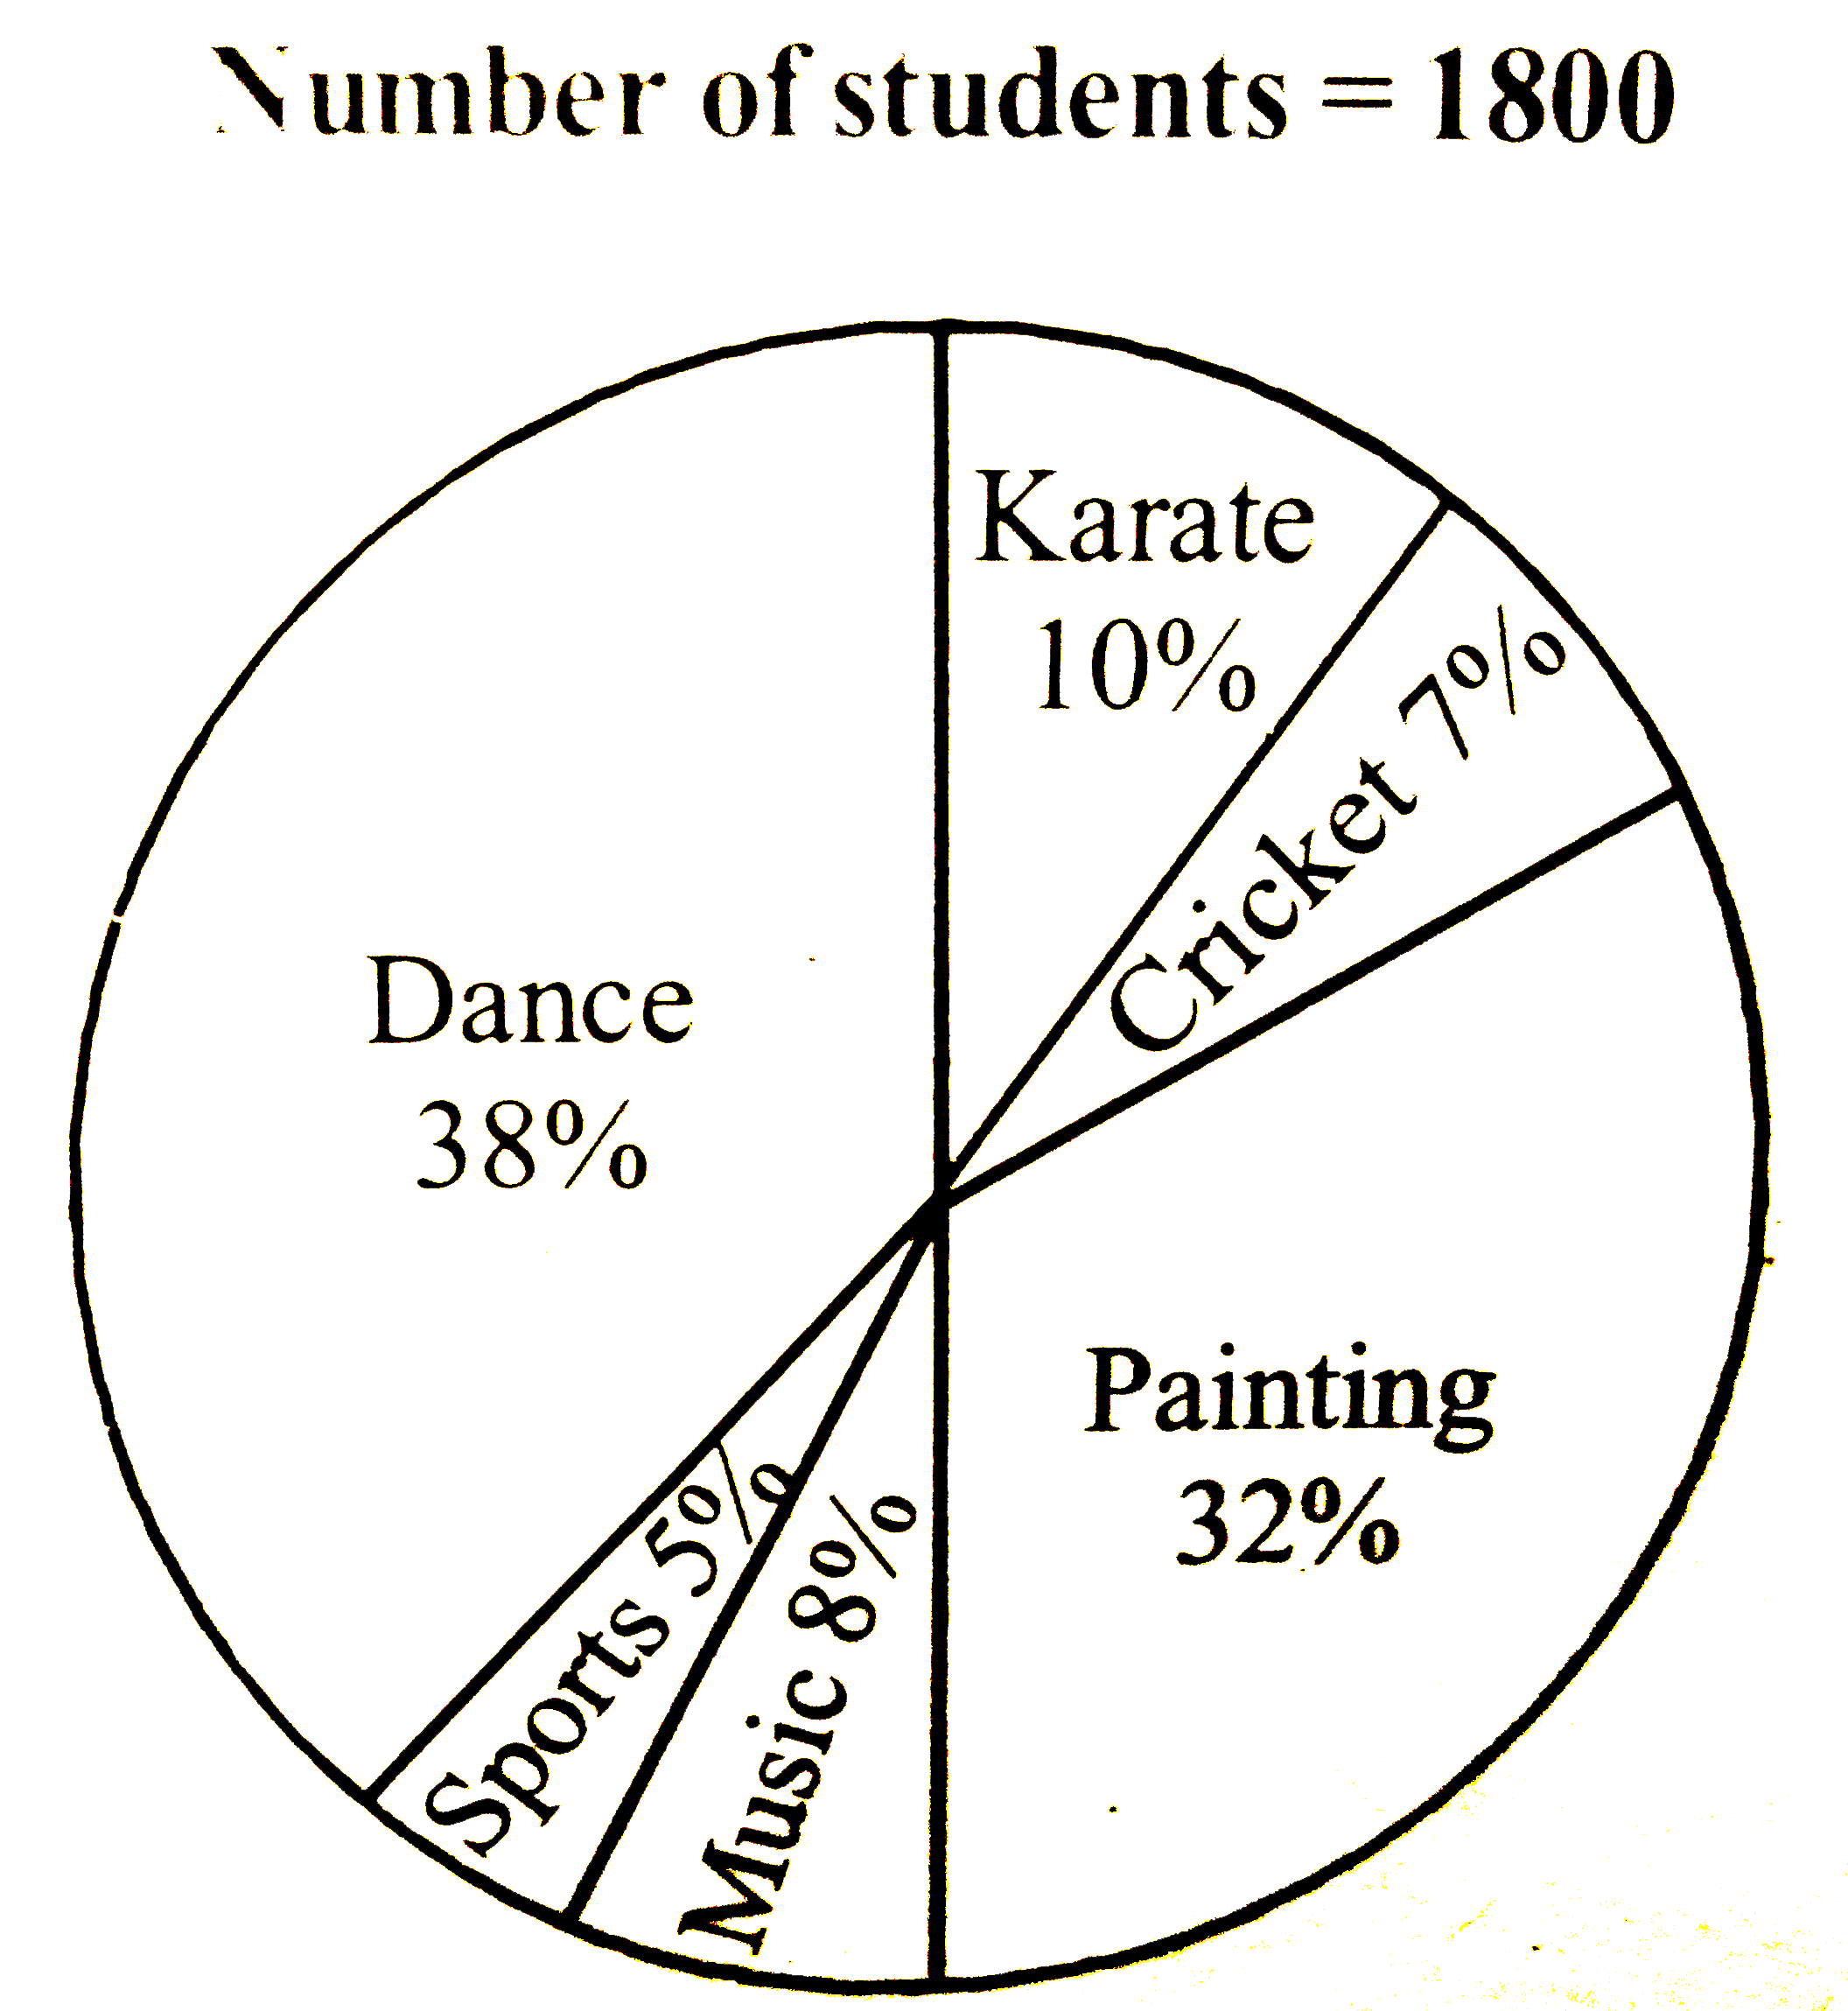
By what percent is the number of candidats who opted for music more than those who opted for sports ?
View Solution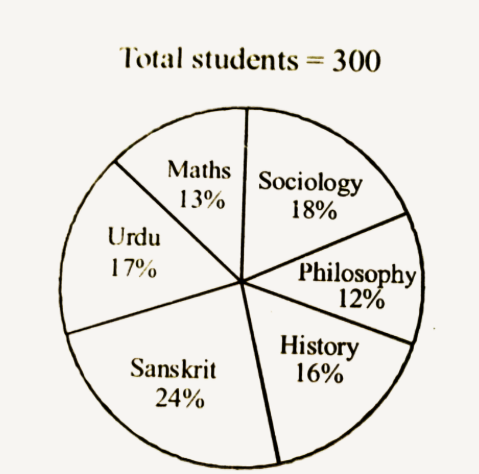
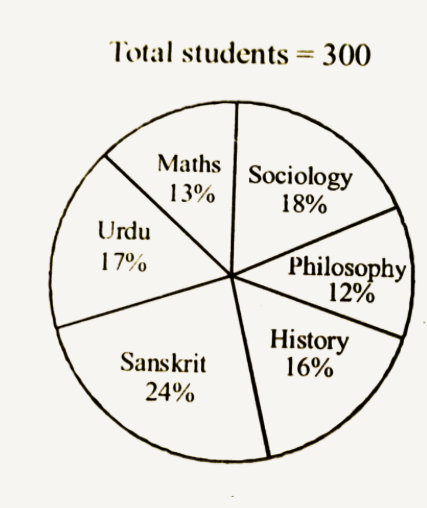
Find the average number of students who opted for Maths, Sociology and Sanskrit together ?
View Solution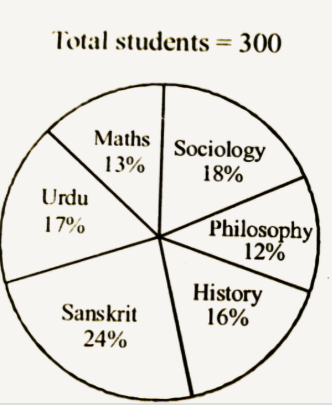
Find the ratio between total number of students who opted for Urdu, Histry and Sociogy together to total number of students who opted for Maths, Urdu and Sanskrit together ?
View Solution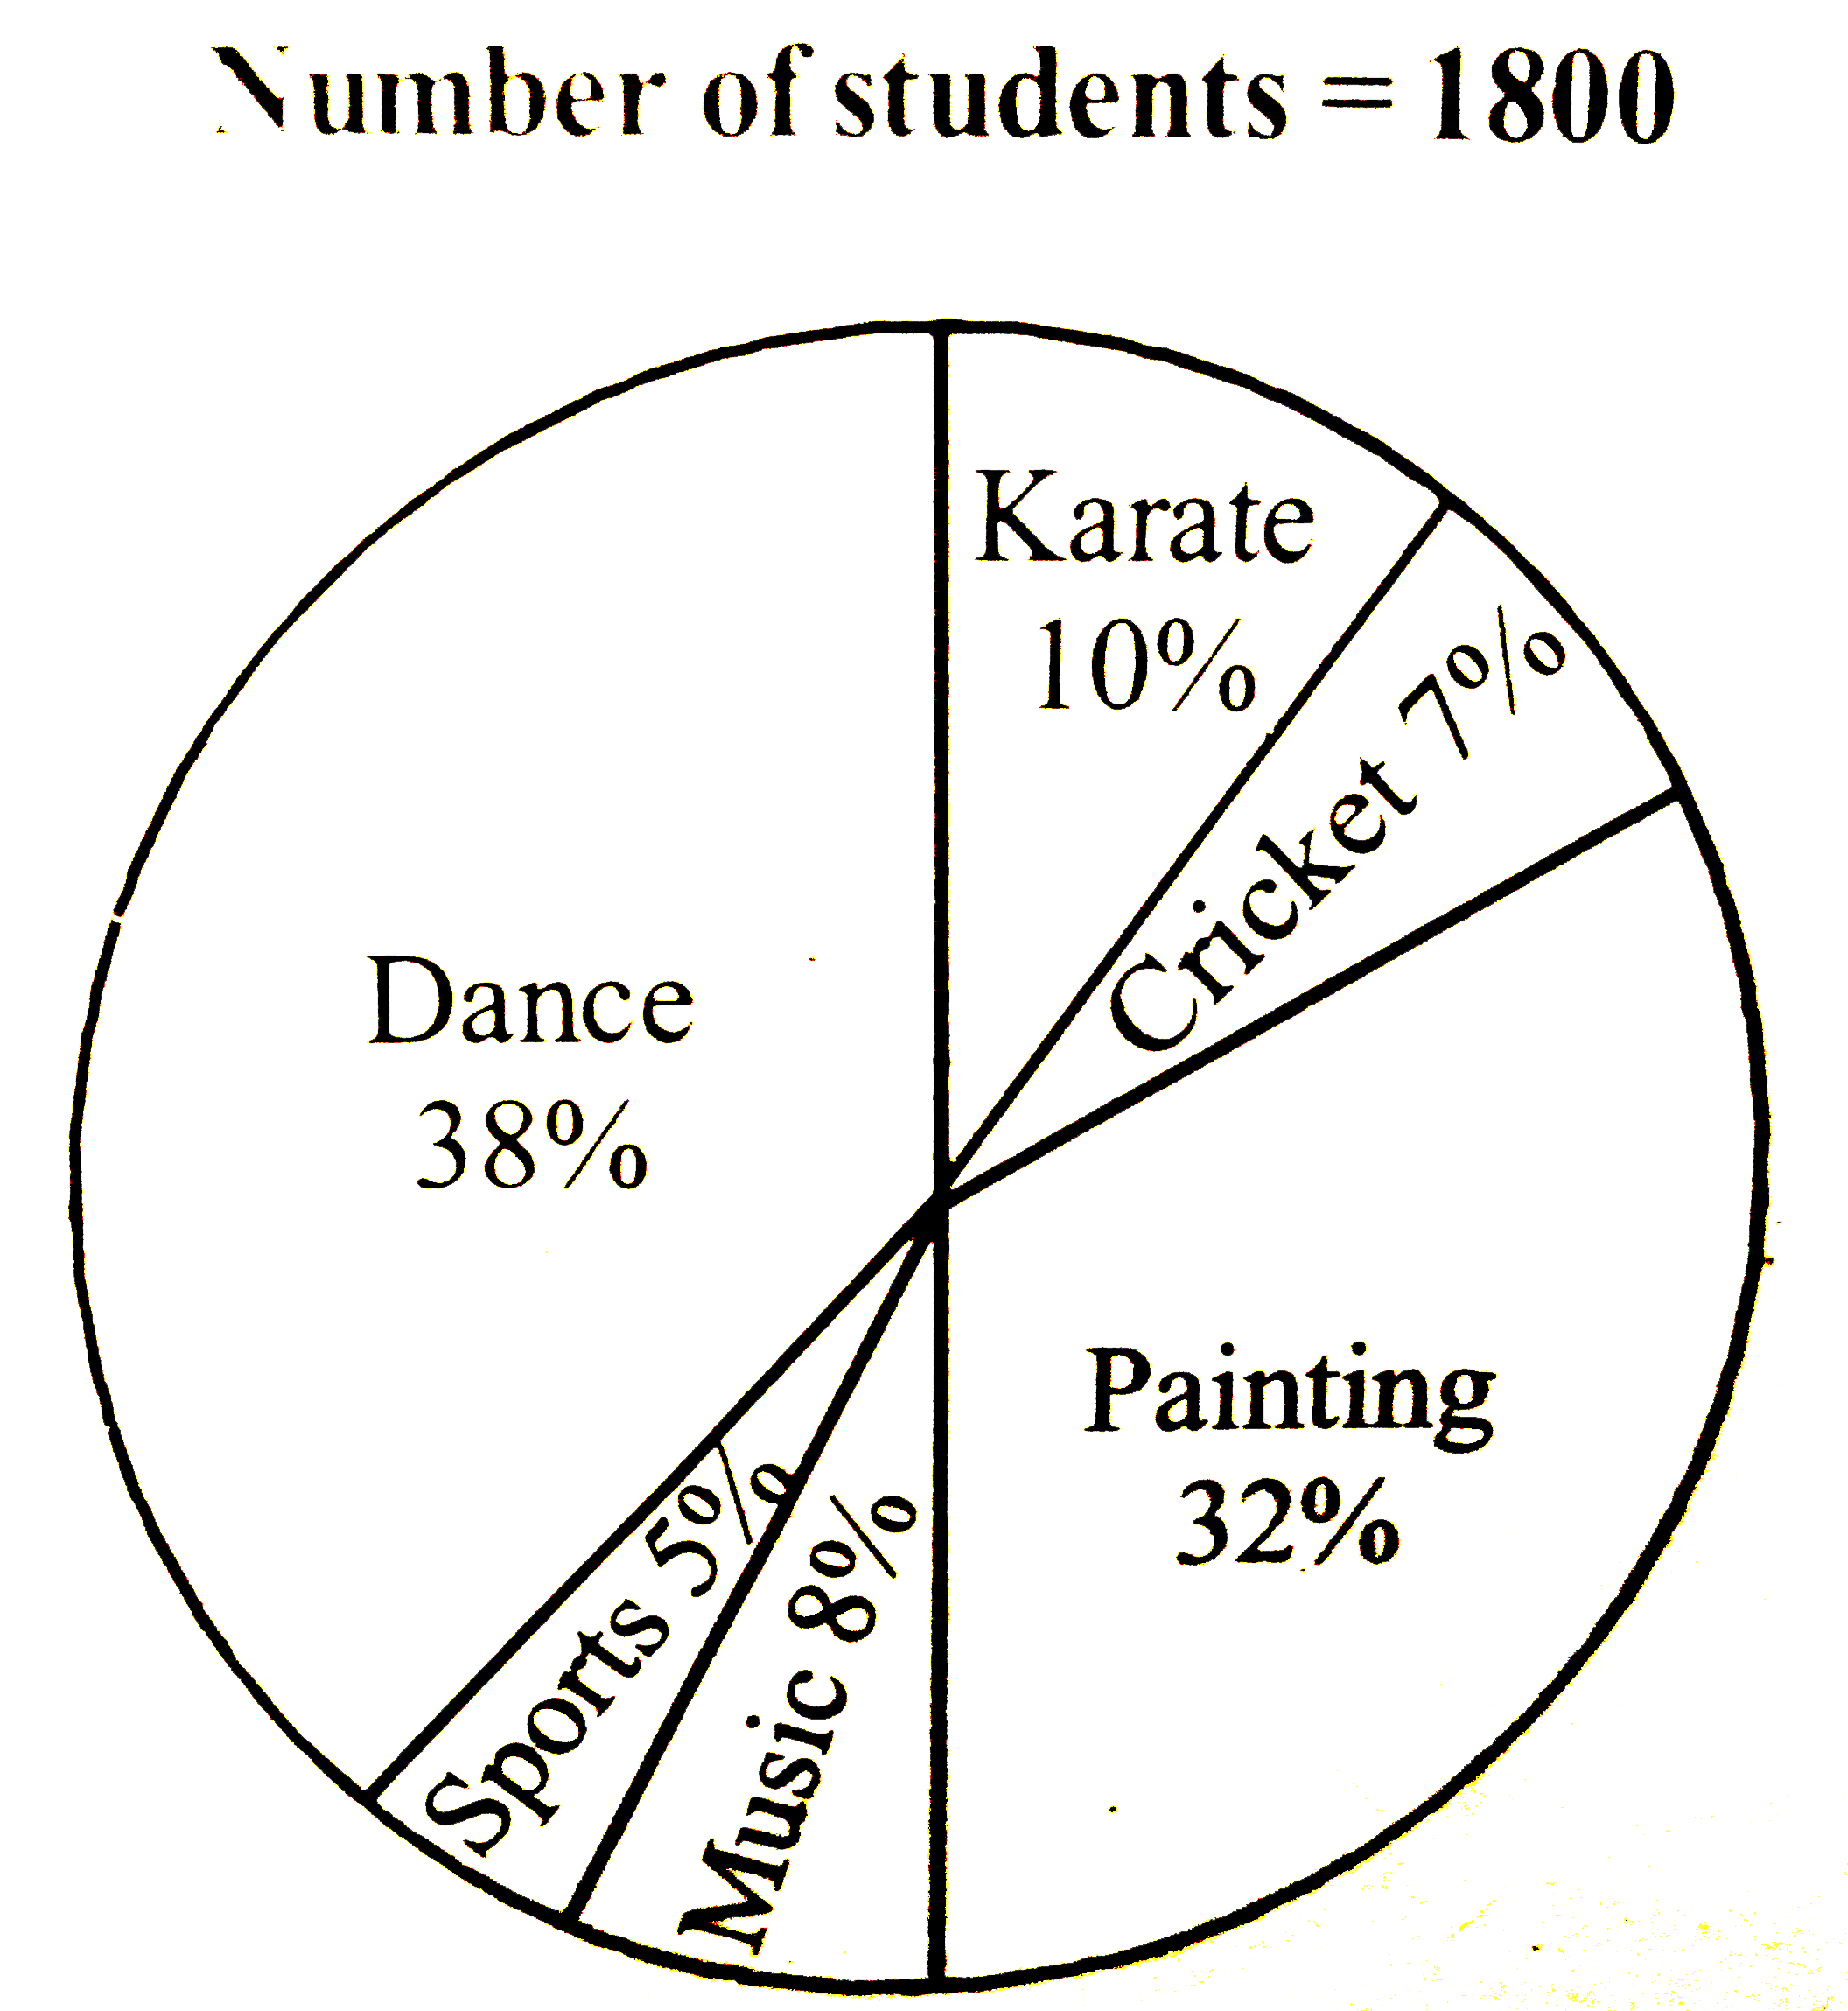
By What percent is the number of students who opted for cricket and dancing together more than those who opted for painting and music together ?
View Solution
Total number of students who opted fo Sociologyy and Philosophy together is how much less than total number of students wo opted for Sanskrit and History together ?
View Solution

