Refer to the graph and answer the given questions.
Data related to number of calories burned by two individuals (A and B) on treadmill during 5 days
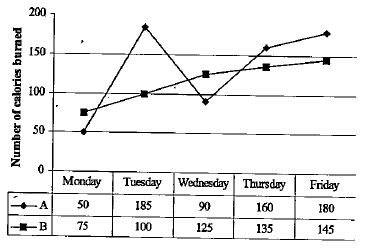
If the number of calories burned by A and B increased by and respectively from Friday to Saturday, what was the total number of calories burned by them together on Saturday?
378
372
368
384
The correct Answer is:B
Step by step video, text & image solution for Refer to the graph and answer the given questions. Data related to number of calories burned by two individuals (A and B) on treadmill during 5 days If the number of calories burned by A and B increased by 10% and 20% respectively from Friday to Saturday, what was the total number of calories burned by them together on Saturday? by Maths experts to help you in doubts & scoring excellent marks in Class 14 exams.
Similar Questions
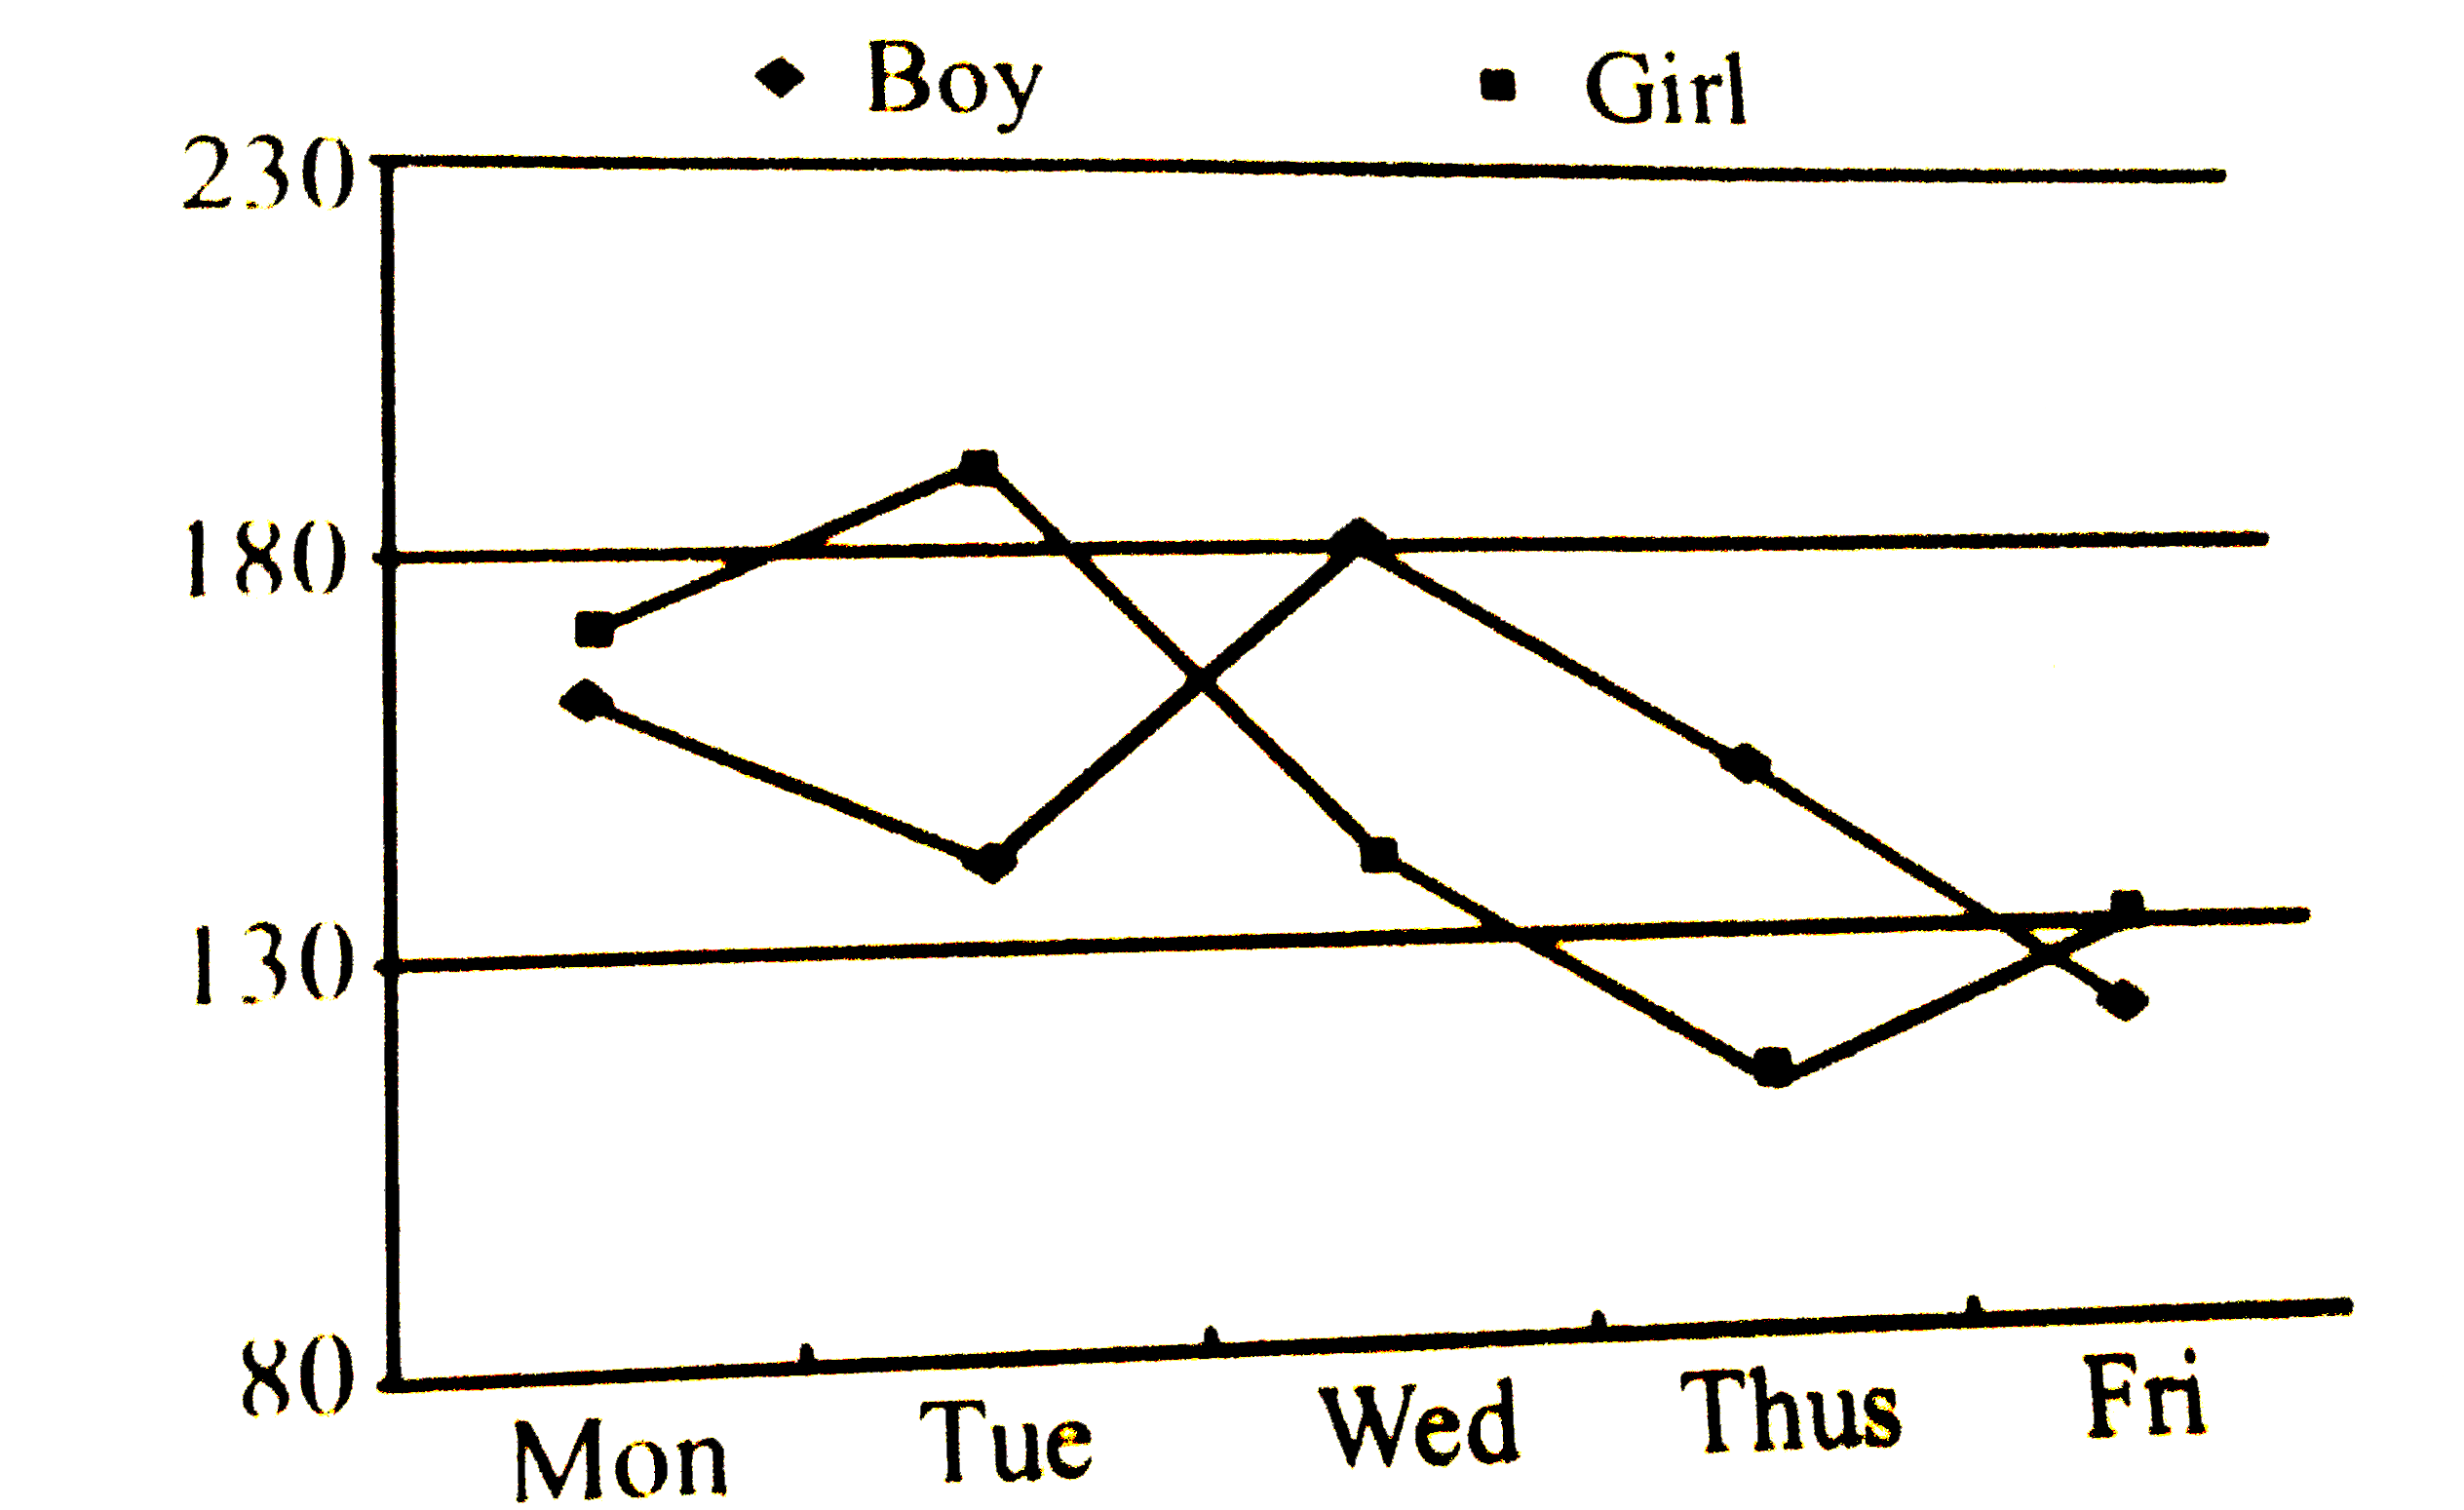
If on Saturday the number of boys and number of girls increased by 25% and 20% respectivley as compared to that on Friday then find the total number of boys and girls together visited the place on Saturday ?View SolutionDirections: Refer to the following graph and answer the given questions. Data related to the number of shoes sold by two stores (A and B )during five years:
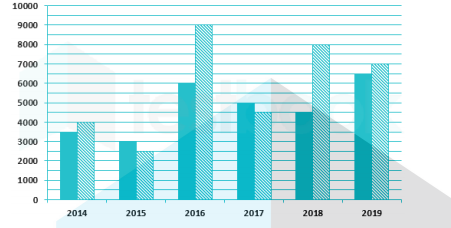
The number of shoes sold by store A decreased by what percent from 2017 to 2018?View Solution
Knowledge Check
- Question 1 - Select One
Three numbers A,B and C are in the ratio 2 : 3 : 5. If each number is increased is increased by 20 % , 40 % and 60%, respectively then what will be the new ratio ?
A15:21:40B13:21:33C12:17:35D12:21:40 - Question 2 - Select One
The number of employees in companies A, B and C are in the ratio 3:2: 4 respectively. If the number of employees in the three companies is increased by 20%, 30% and 15% respectively, what will be the new ratio of employees working in companies A, B and C respectively?
A18:13:24B13:18:23C17:13:23D18:13:23
Directions: Refer to the following graph and answer the given questions. Data related to the number of shoes sold by two stores (A and B )during five years:
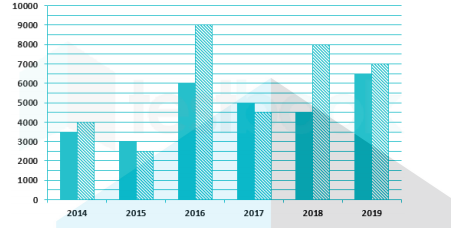
If the respective ratio between the total number of shoes sold by stores A and B together in 2014 and that in 2020 is 5 : 7.What is the total number of shoes sold by stores A and B together in 2020?View SolutionDirections: Refer to the following graph and answer the given questions. Data related to the number of shoes sold by two stores (A and B )during five years:
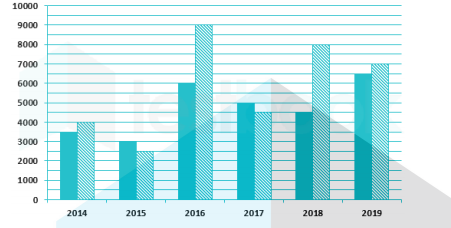
What is the difference between the total number of shoes sold by store A in 2018 and 2019 together and the total number of shoes sold by store B in 2014 and 2015 together?View SolutionDirections: Refer to the following graph and answer the given questions. Data related to the number of shoes sold by two stores (A and B )during five years:
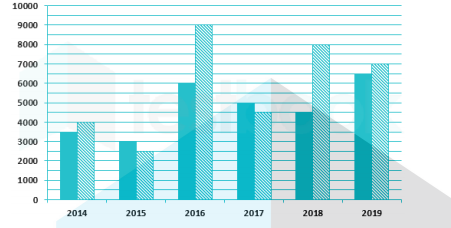
Find the difference between the total number of Shoes sold by Store A and B in all the years together?View SolutionDirections: Refer to the following graph and answer the given questions. Data related to the number of shoes sold by two stores (A and B )during five years:
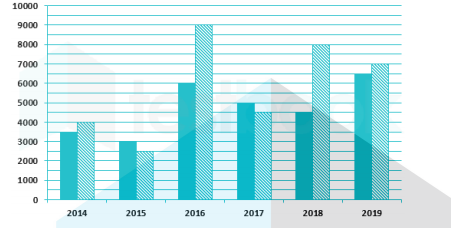
Find the ratio between the total number of shoes sold by stores A and B together in 2016 to the total number of shoes sold by stores A and B together in 2018?View SolutionStudy the bar graph and answer the question
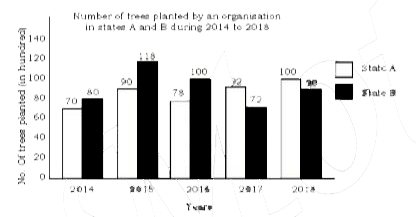
The total number of trees planted in state B in 2015 and 2017 was what percentage less than the total number of trees planted in state A in 2014 2016 and 2017View SolutionStudy the given pie chart and answer the question that follows
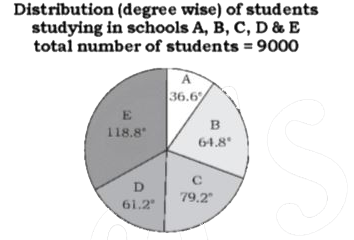
The total number of students in schools D and E is what percentage more than the number of students in schools B and C?View Solution
