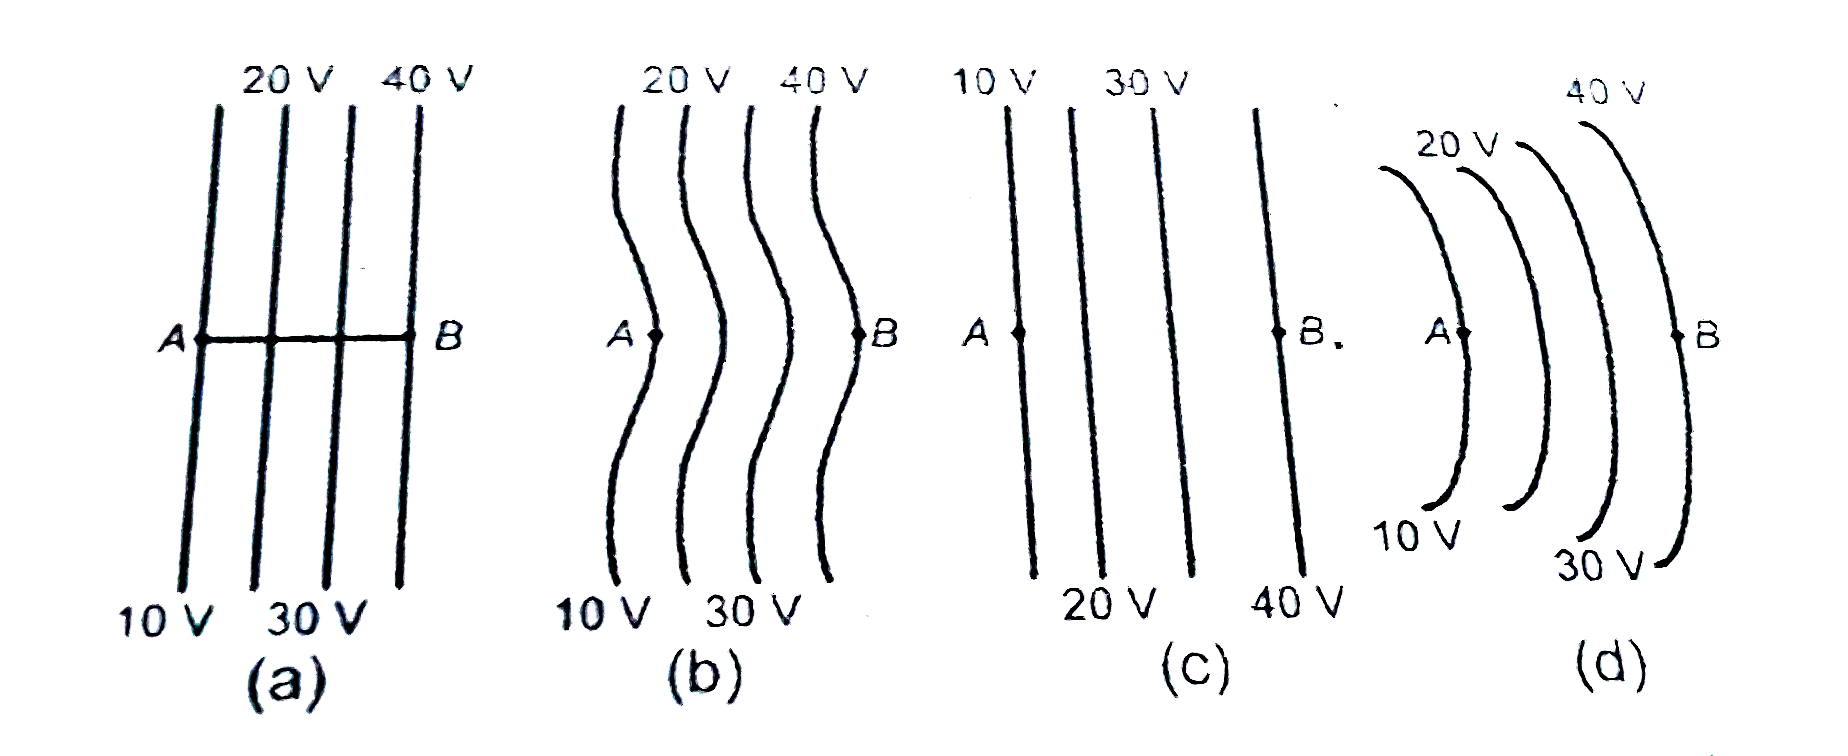
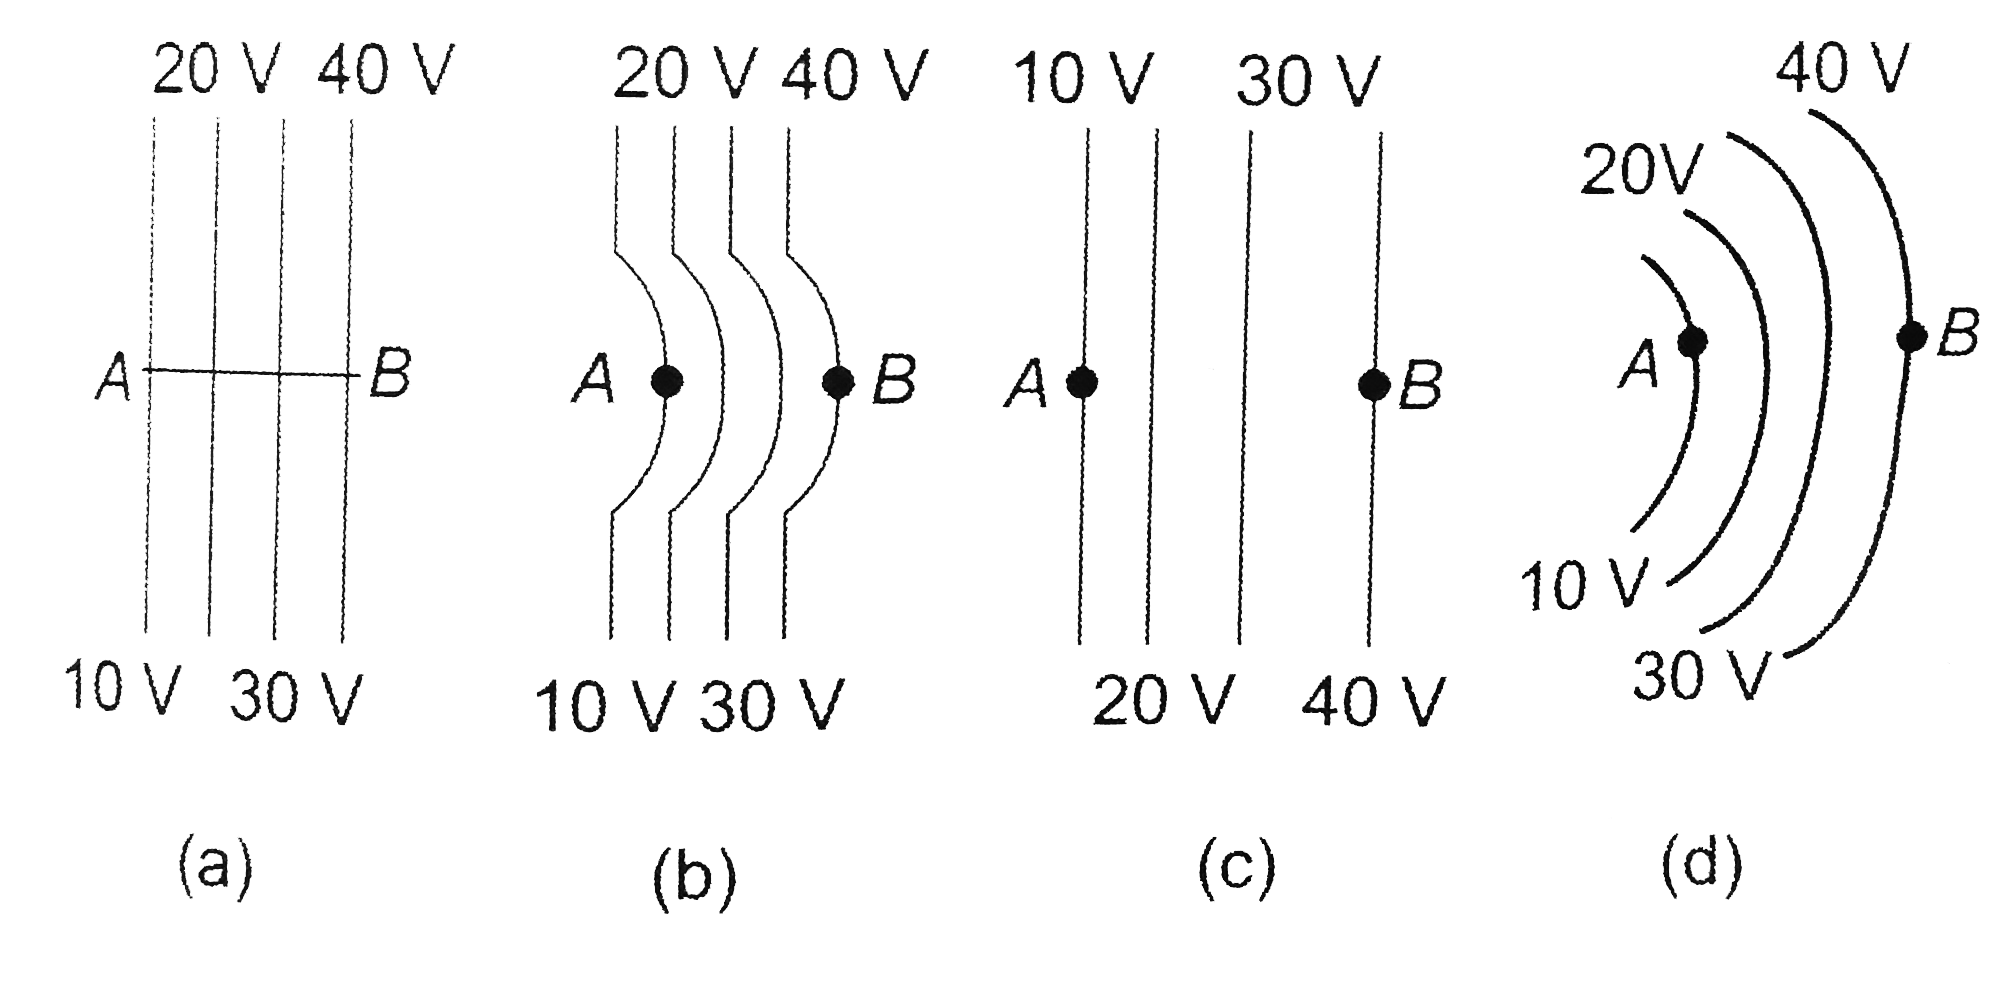
The diagrams below show regions of equipotentials.
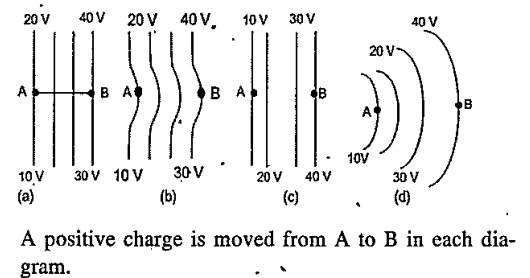
Maximum work is required to move q in figure (c ).
In all the four cases the work done is the same.
Minimum work is required to move q in figure (a).
Maximum work is required to move q in figure (b).
The correct Answer is:B
Step by step video, text & image solution for The diagrams below show regions of equipotentials. by Physics experts to help you in doubts & scoring excellent marks in Class 14 exams.
Updated on:21/07/2023Similar Questions
Knowledge Check
The diagrams below show region of equipotentials.
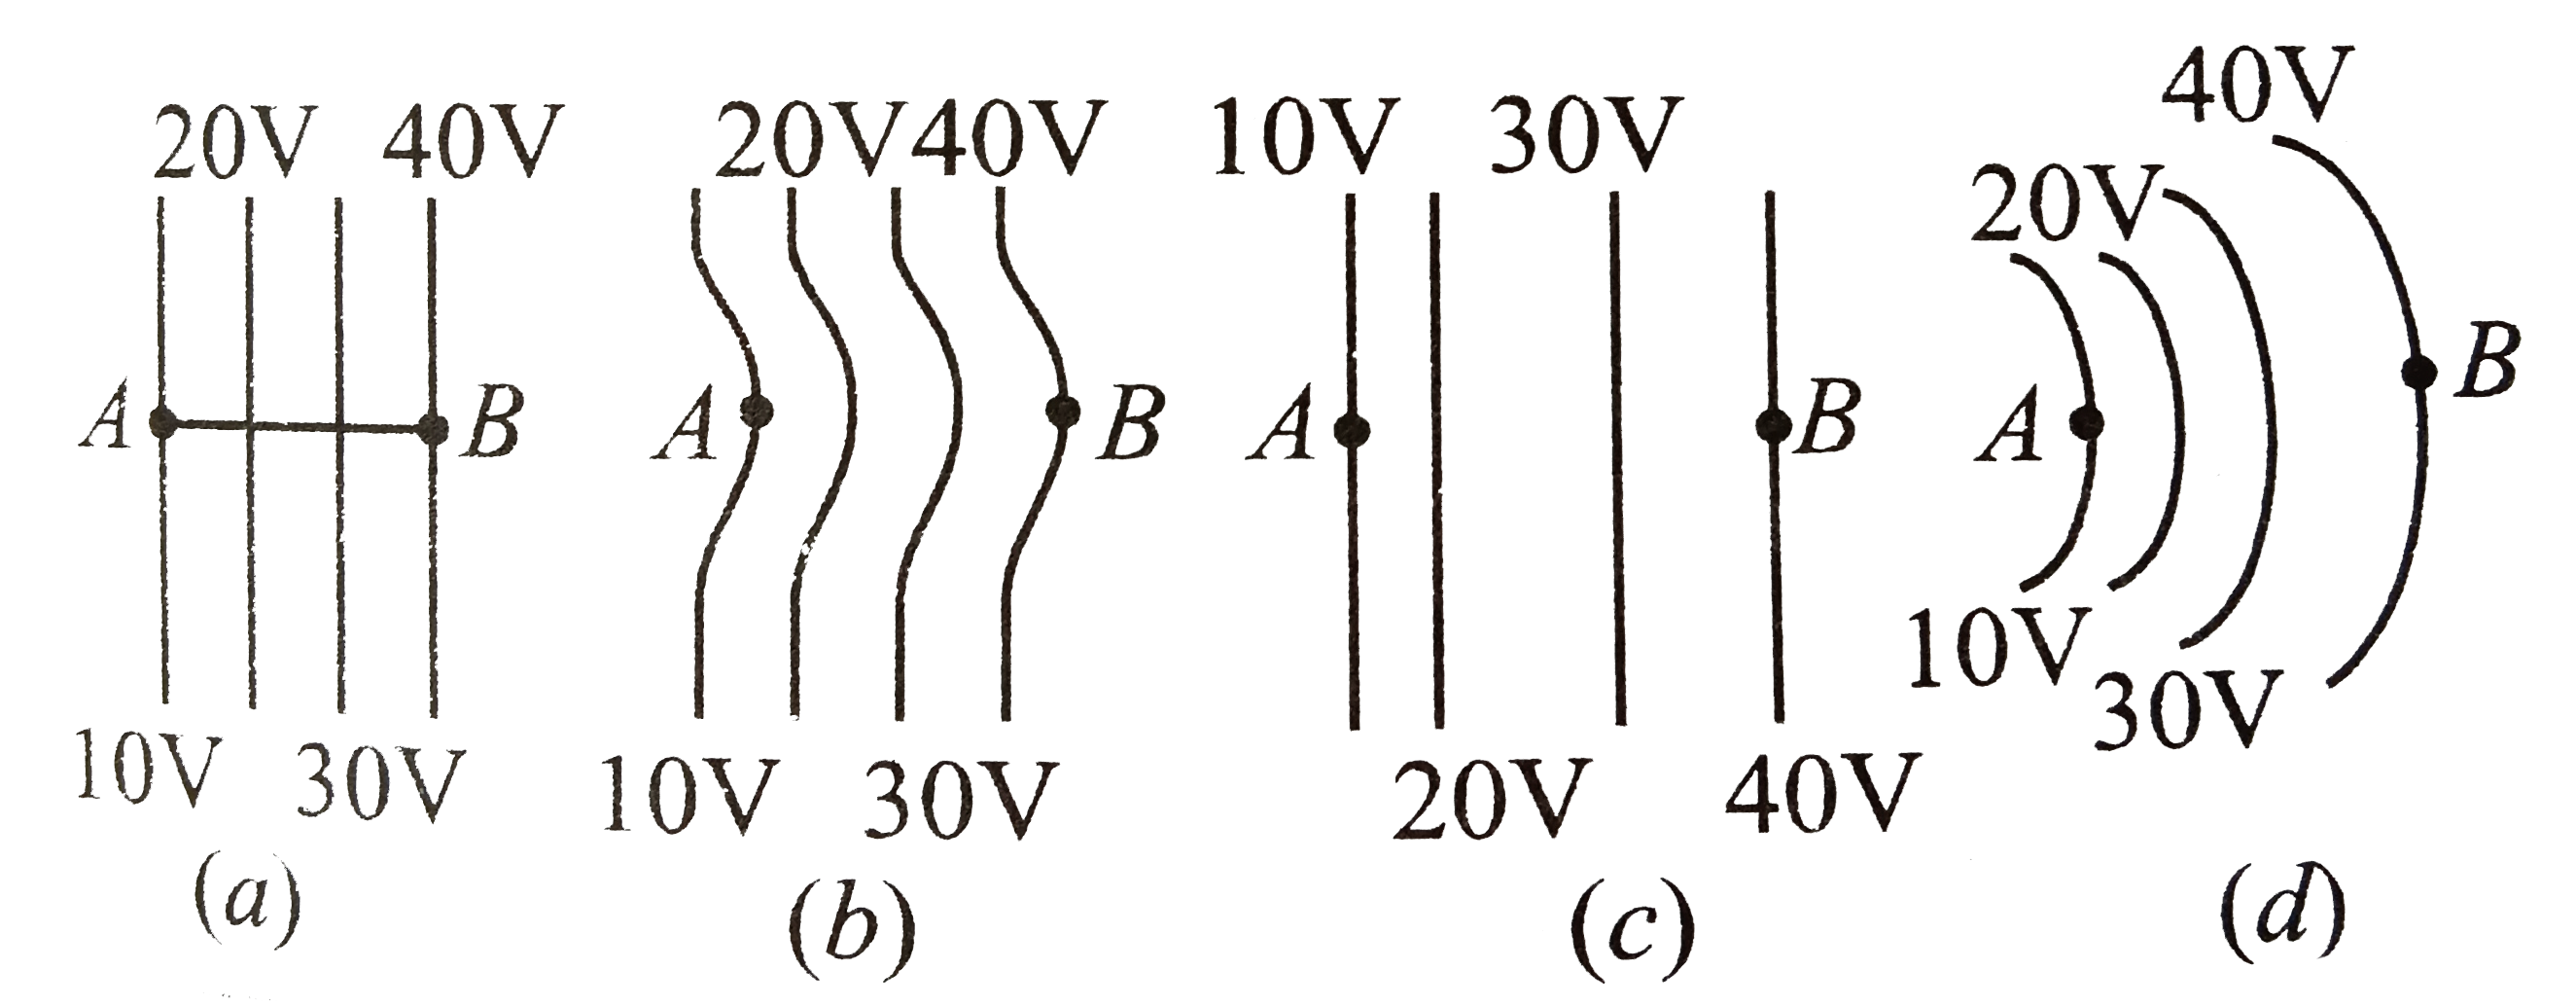 AMaximum work is required to move q in figurec (c ).BIn all the four cases, the work doen is the same.CMinimum work is required to move q in figurec (a).DMaximum work is required to move q in figurec (b ).
The diagram below show regions of equipotentials.
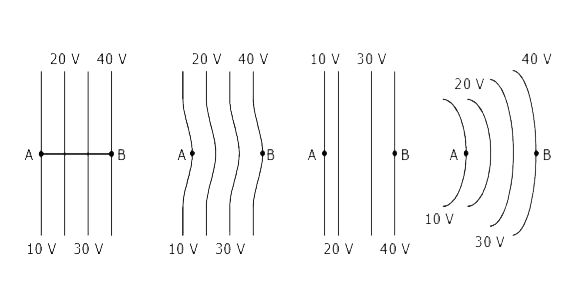
A positive charge is moved from A to B in each diagram.AIn all the four cases the work done is the same.BMinimum work is required to move q in figure (a)CMaximum work is required to move q in figure (b)DMaximum work is required to move q in figure (c )The diagram below show region of equipotentials.
A positive charge is moved from A to B in each diagram .AIn all the four cases the work done is the sameBMinimum work is required to move q in figure (a)CMaximum work is required to move q in figure (b)DMaximum work is required to move q in figure (c )
The diagram below shows a list of decimals.

Which are the highest and lowest decimals?
View SolutionThe diagram below show regions of equipotential:
A positive chrages is moved from A to B in each diagram.
View Solution
Above diagrams shows
View SolutionThe diagram below shows the flow of materials between trophic levels. Which arrow is incorrect?

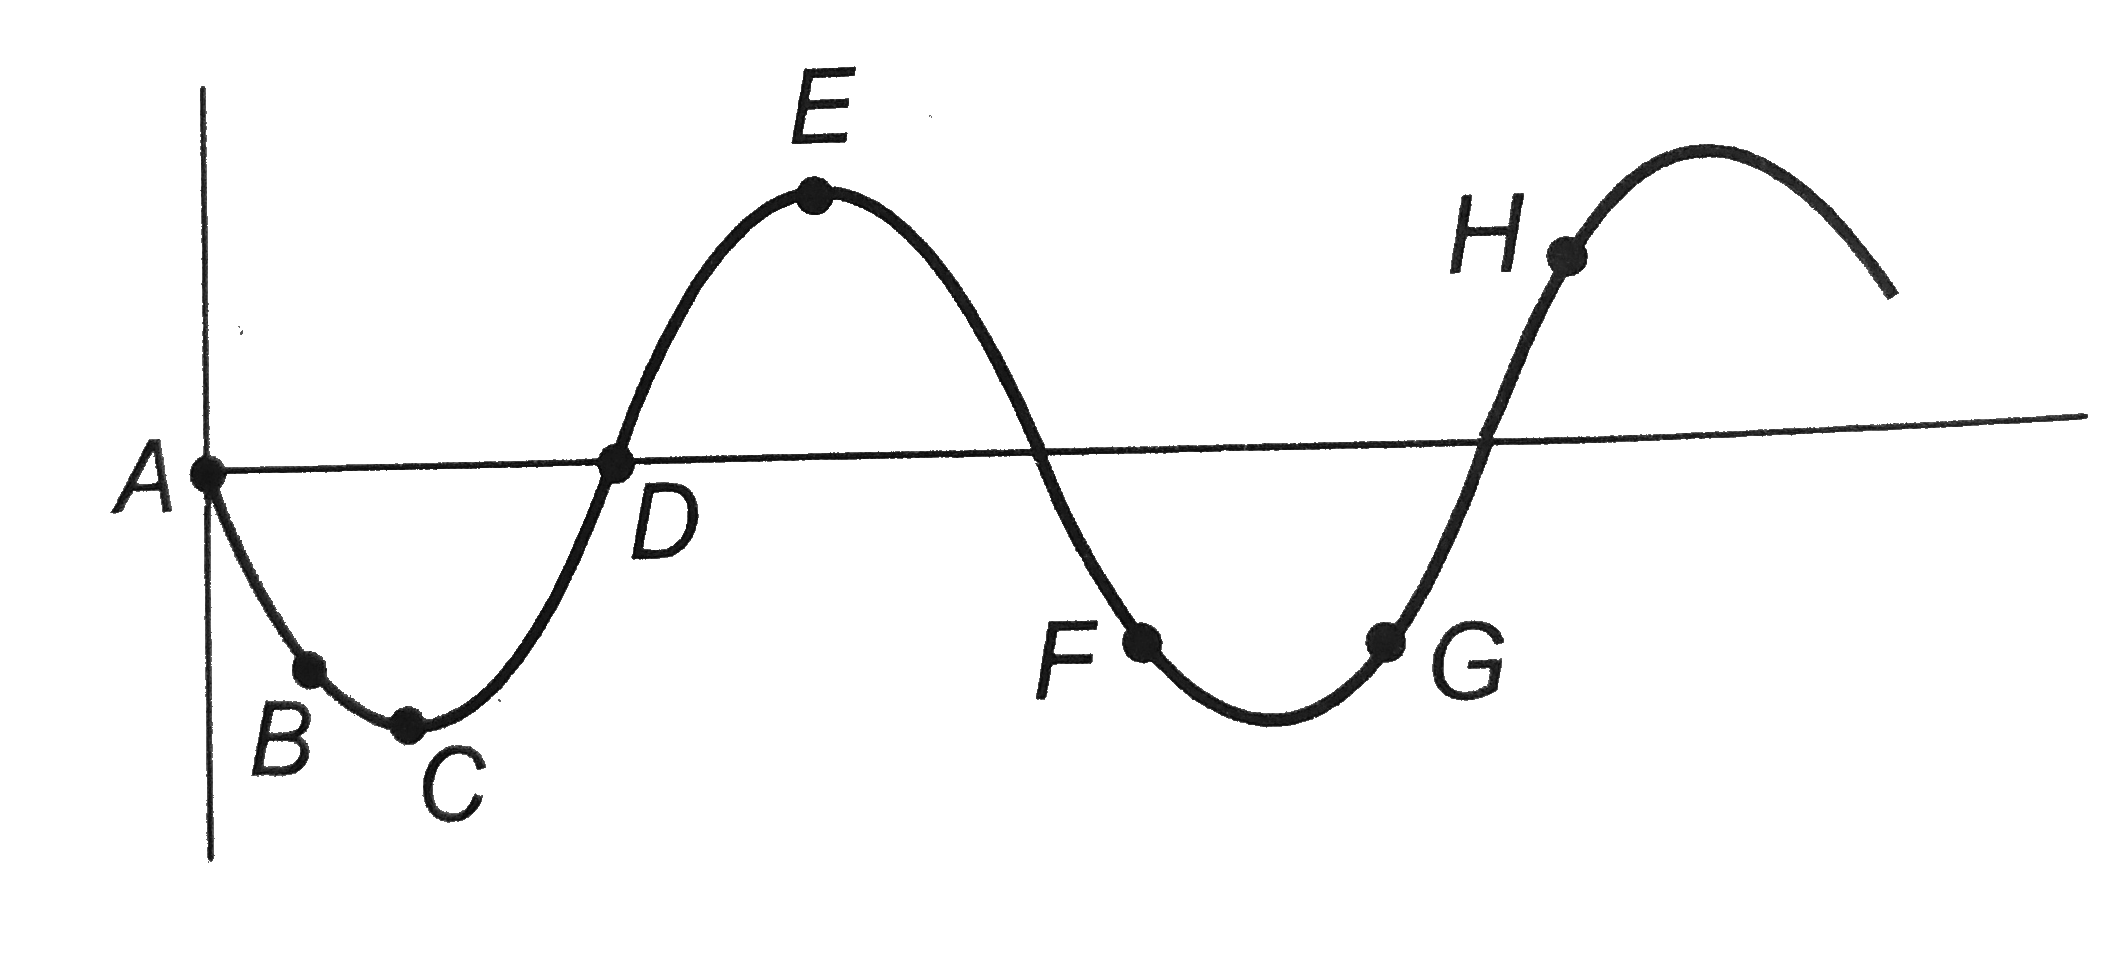
View SolutionThe diagram below shows the propagation of a wave. Which points are in same phase?
 .
.
View Solution

