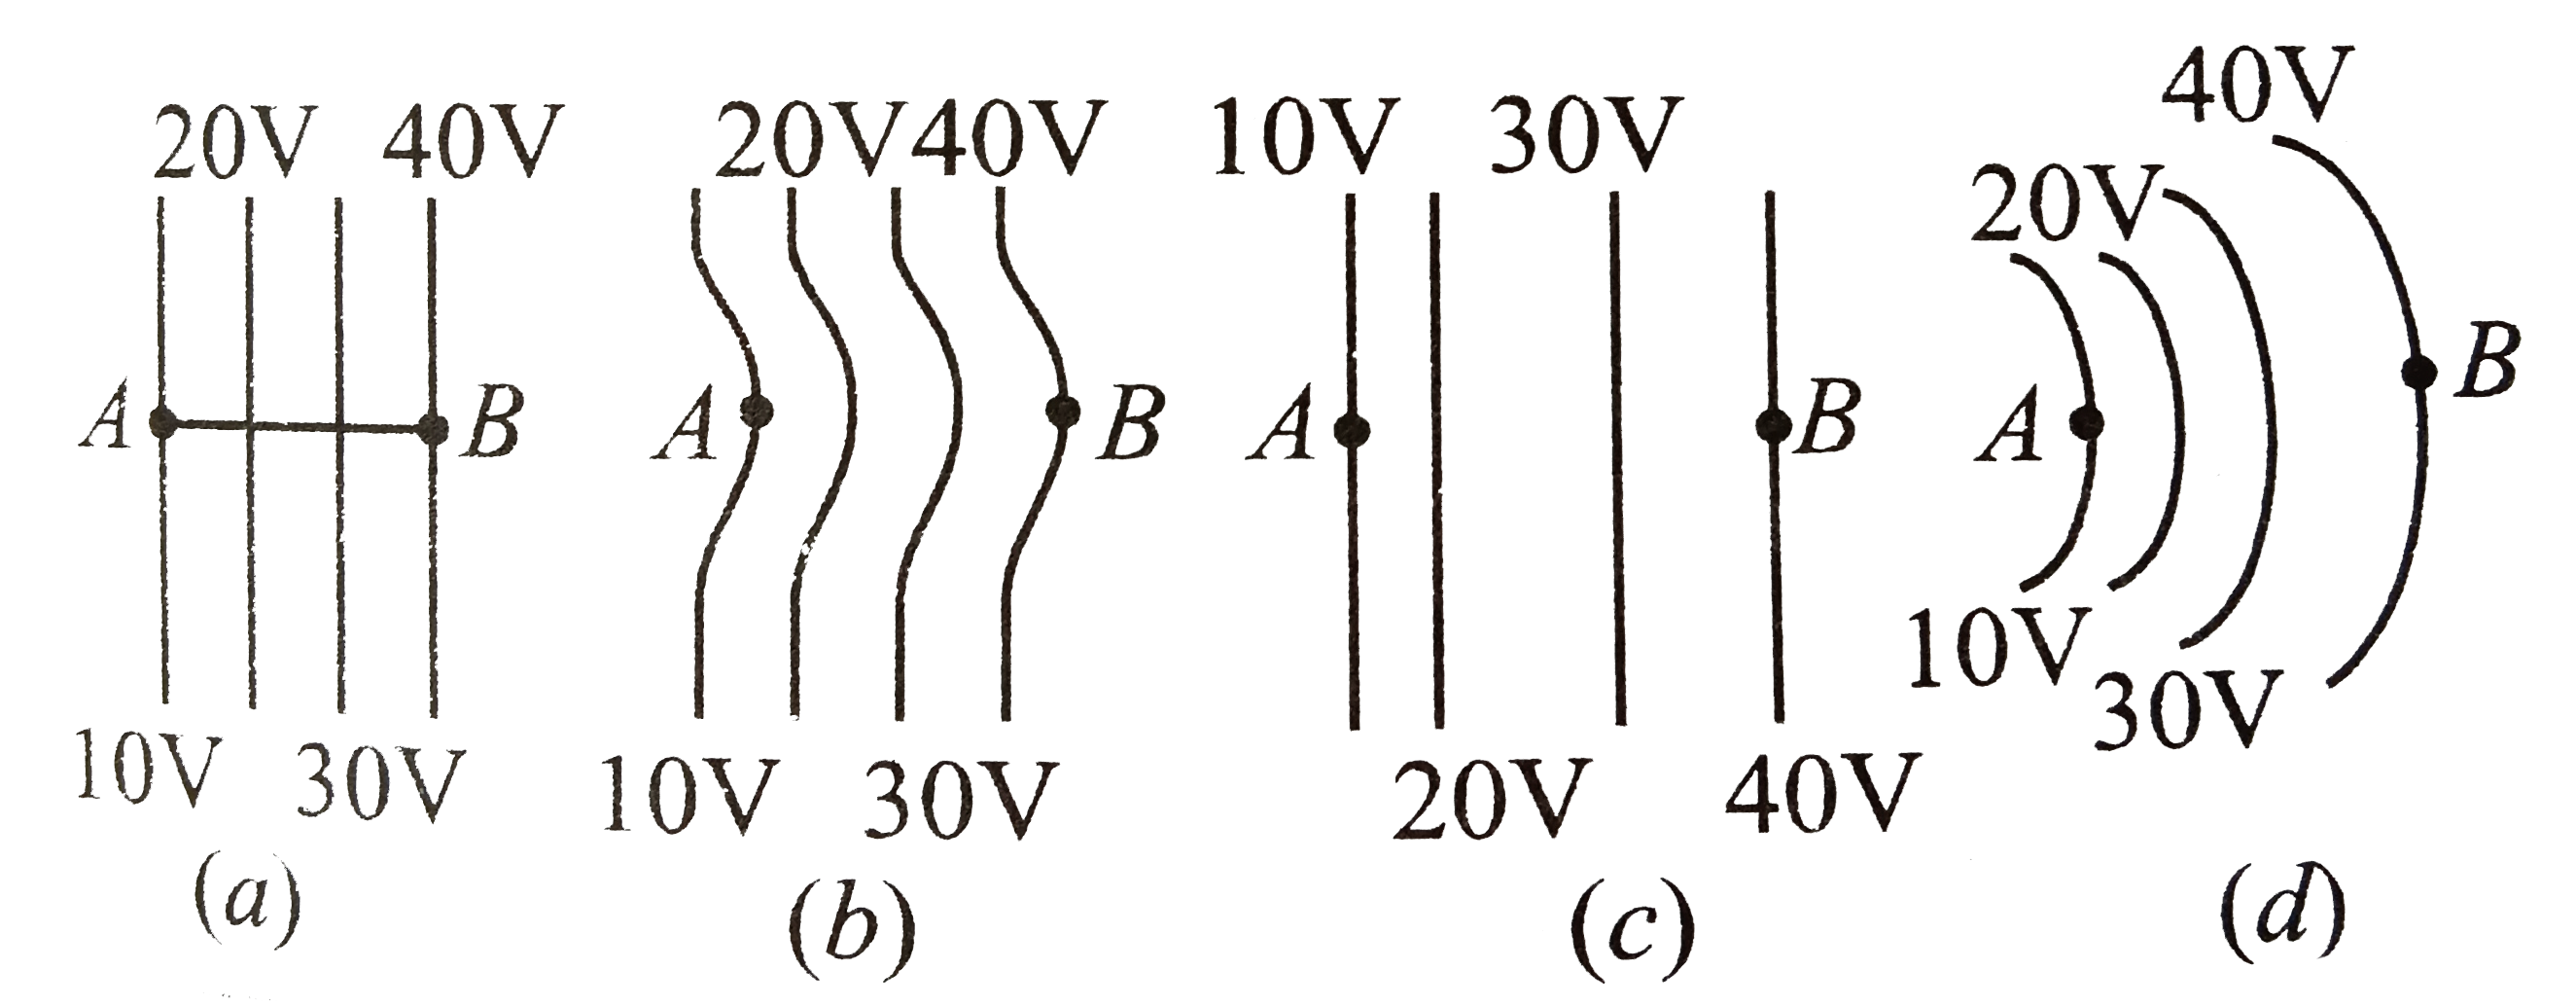
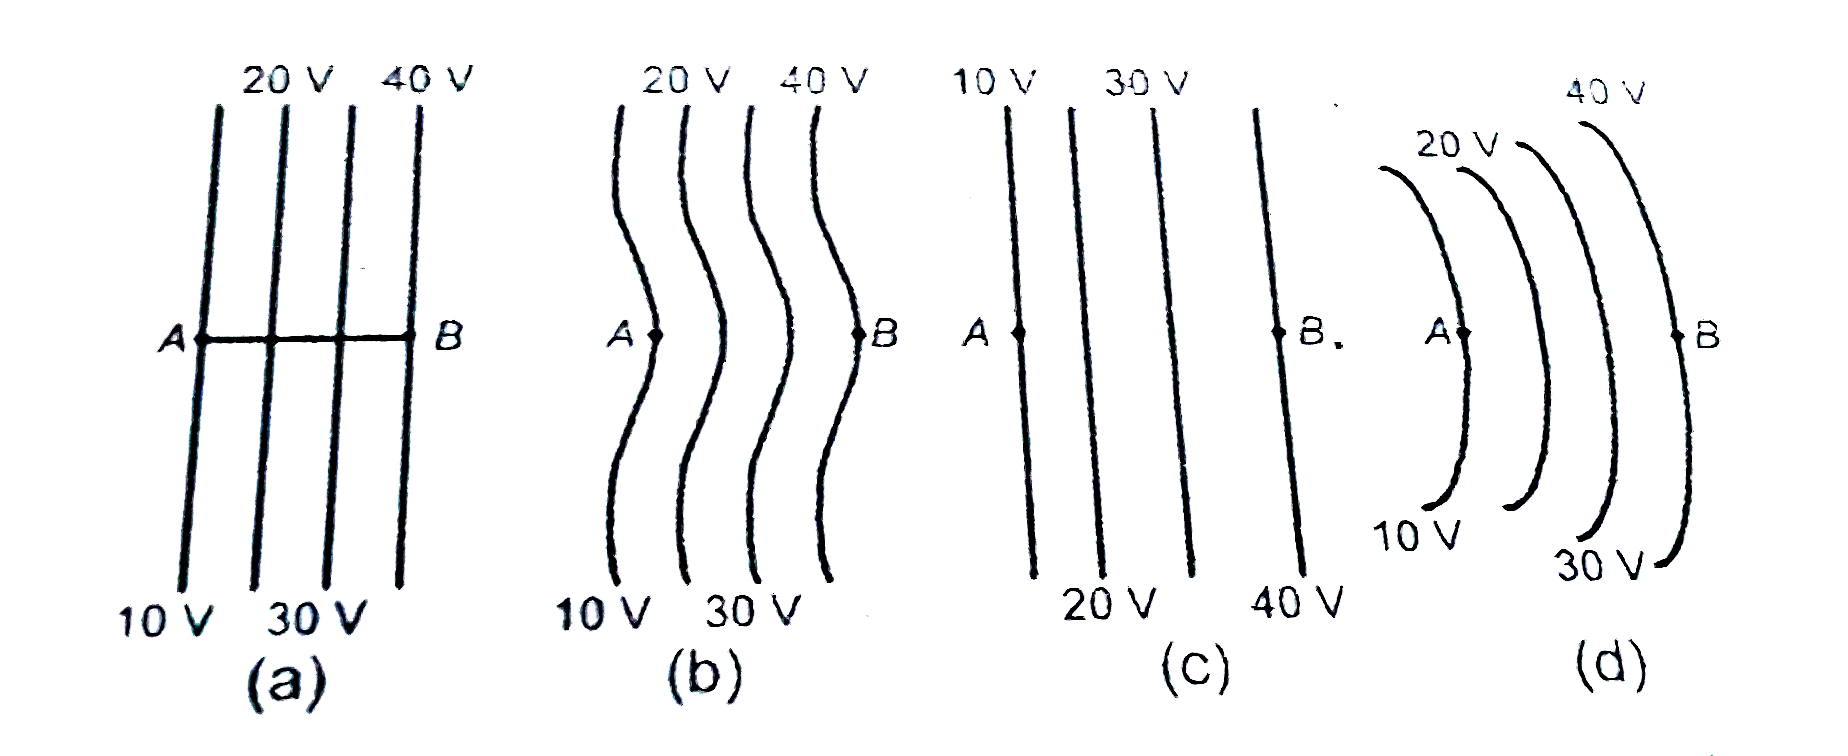
The diagrams below show region of equipotentials.
A
Maximum work is required to move q in figurec (c ).
B
In all the four cases, the work doen is the same.
C
Minimum work is required to move q in figurec (a).
D
Maximum work is required to move q in figurec (b ).
Video Solution
Text Solution
The correct Answer is:B
In Fig, when positive charge is moved from A to B it has to go from V1=10volt to V2=30V, in all the four cases.Work done is same as it is independent of the path.
W=q(V2−V1)=same in all the four cases.
|
Topper's Solved these Questions
- ELECTROSTATICSBOOK - PRADEEPCHAPTER - ELECTROSTATICSEXERCISE - FILL IN THE BLANKS
8 Videos
- ELECTROSTATICSBOOK - PRADEEPCHAPTER - ELECTROSTATICSEXERCISE - PROBLEMS FOR PRACTICE
8 Videos
- ELECTROSTATICSBOOK - PRADEEPCHAPTER - ELECTROSTATICSEXERCISE - VALUE BASED QUESTIONS
7 Videos
- ELECTRONIC DEVICESBOOK - PRADEEPCHAPTER - ELECTRONIC DEVICESEXERCISE - Fill in the Blanks
1 Videos
- MAGNETIC EFFECT OF CURRENT AND MAGNETISMBOOK - PRADEEPCHAPTER - MAGNETIC EFFECT OF CURRENT AND MAGNETISMEXERCISE - Competition Focus (Multiple Choice Questions)
2 Videos
Similar Questions
Knowledge Check
The diagrams below show regions of equipotentials.
A positve charge is moved from A to B in each diagram.
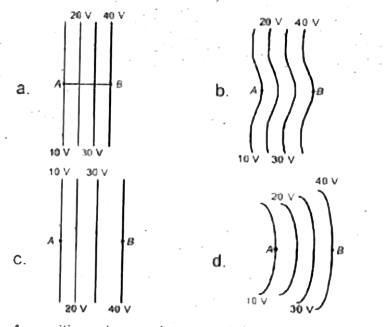 AMaximum work is required to move q in figure (c ).BIn all the four cases the work done is the same .CMinimum work is required to move q in figure (a).DMaximum work is equired to move q in figure (b) .
The diagram below show regions of equipotentials.
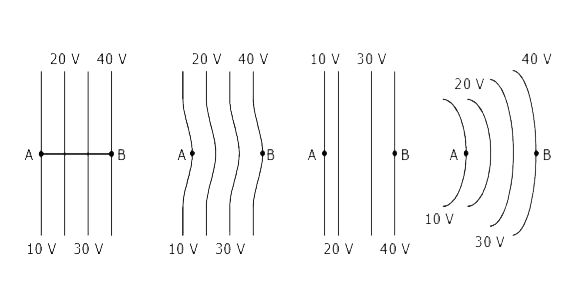
A positive charge is moved from A to B in each diagram.AIn all the four cases the work done is the same.BMinimum work is required to move q in figure (a)CMaximum work is required to move q in figure (b)DMaximum work is required to move q in figure (c )The diagram below show regions of equipotential:
A positive chrages is moved from A to B in each diagram.
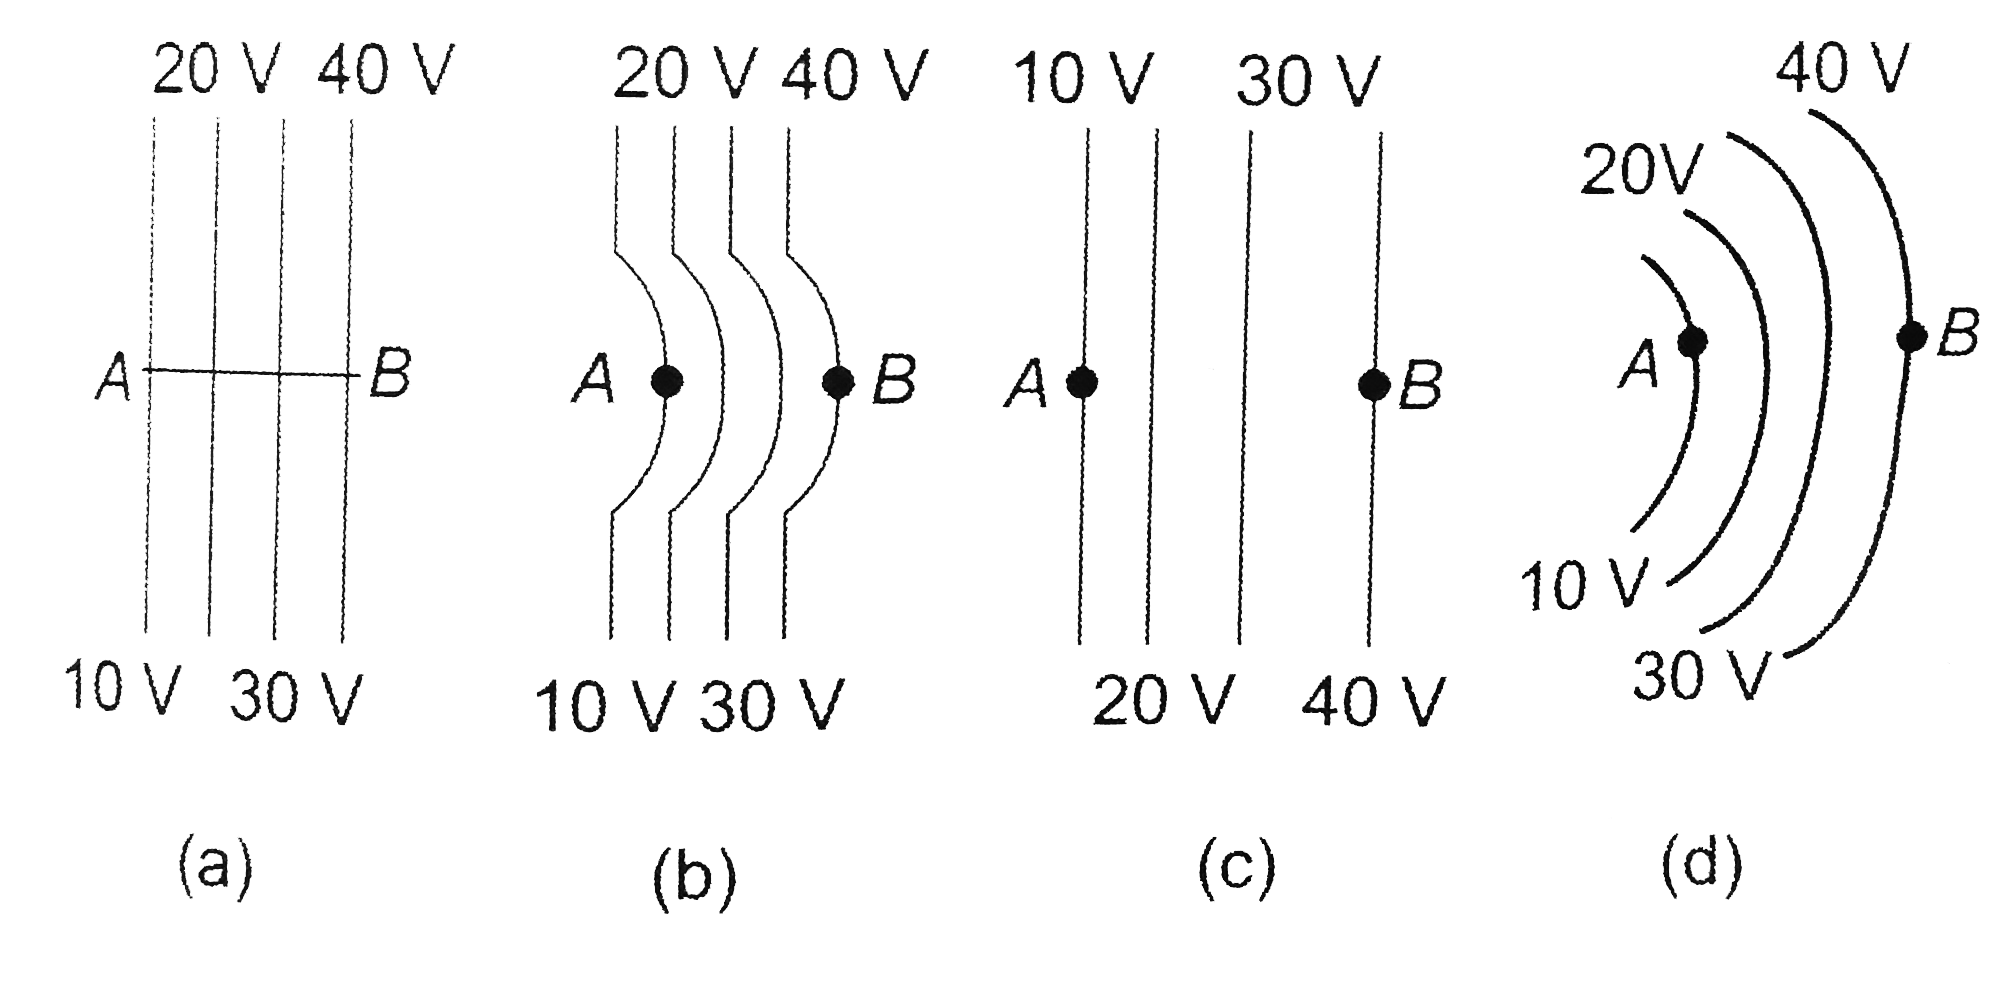 AIn all the four cases the work done is the sameBMinimum work is required to move q is figure (a)CMaximum work is required to move q in figure (b)DMaximum work is required to move q is figure (c)
The diagram below shows a list of decimals.

Which are the highest and lowest decimals?
View SolutionThe diagram below show region of equipotentials.
A positive charge is moved from A to B in each diagram .
View SolutionThe diagram below shows the flow of materials between trophic levels. Which arrow is incorrect?

View Solution
Above diagrams shows
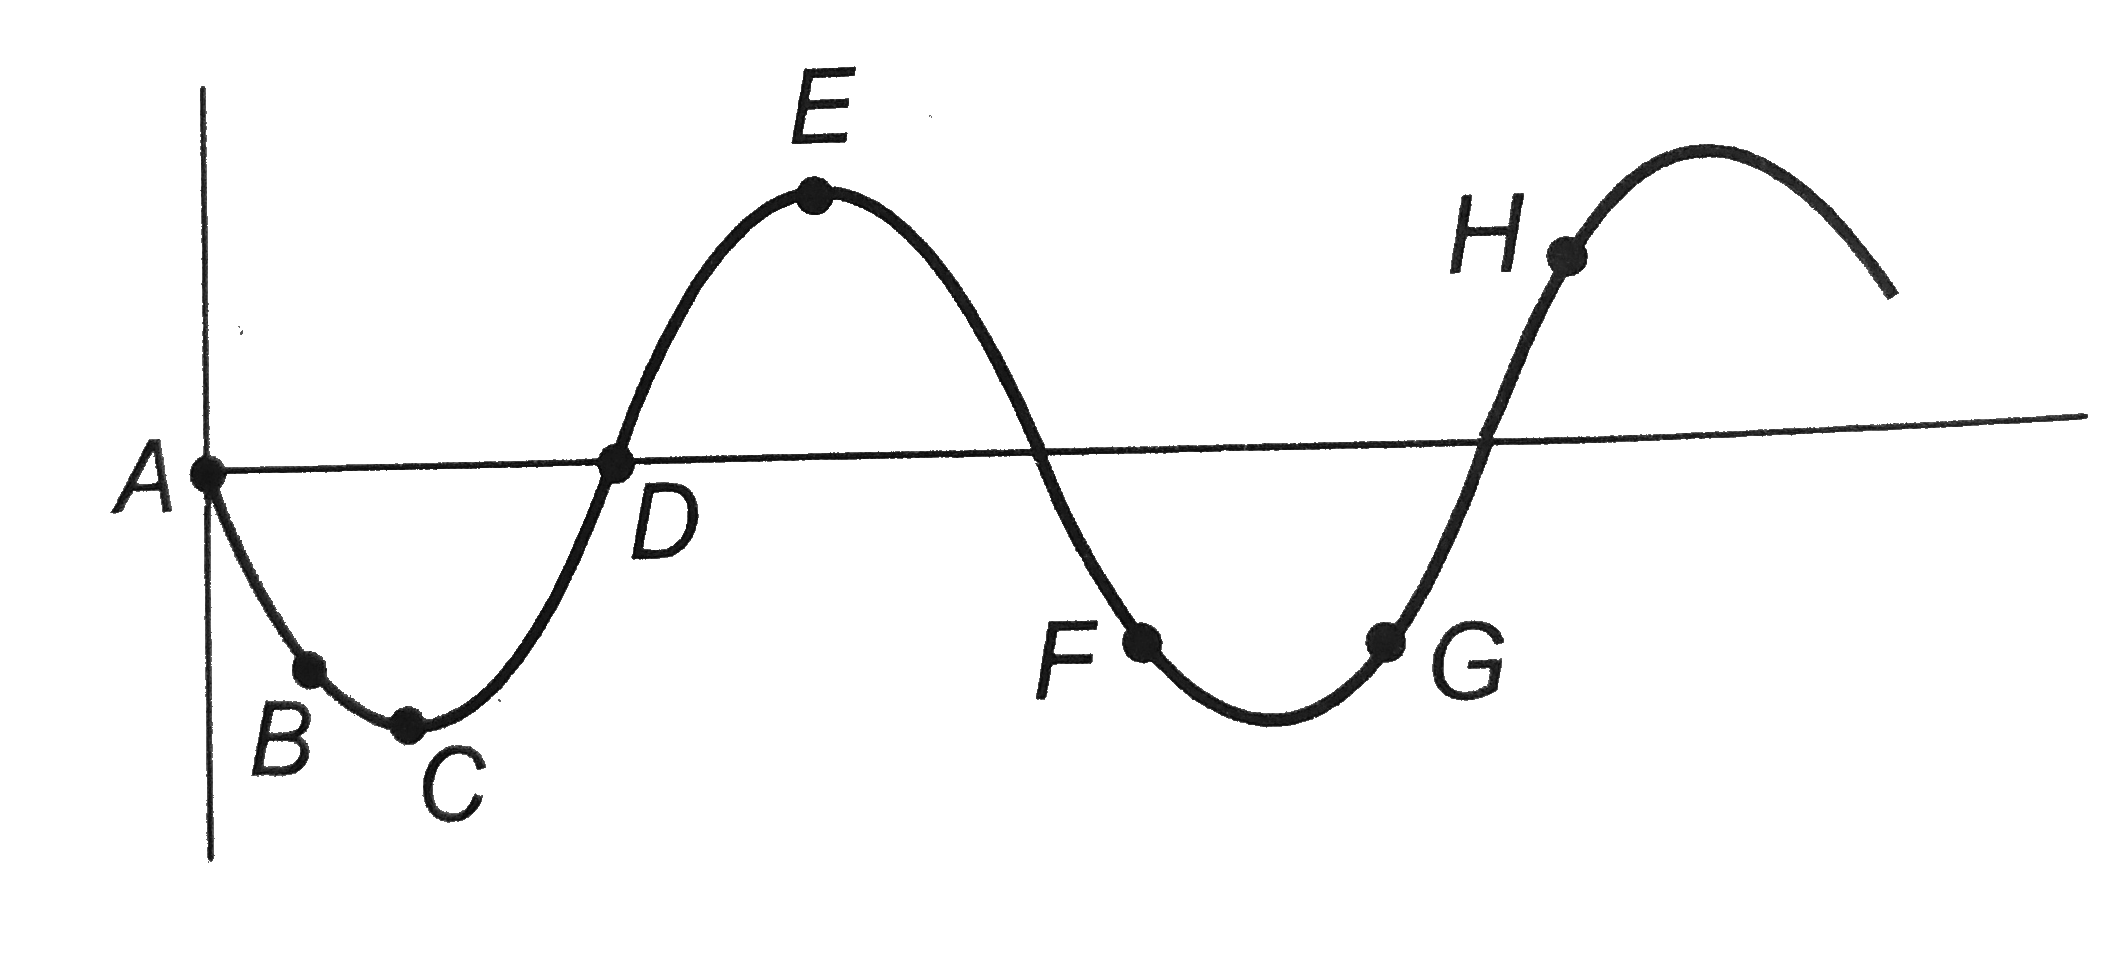
View SolutionThe diagram below shows the propagation of a wave. Which points are in same phase?
 .
.
View Solution

