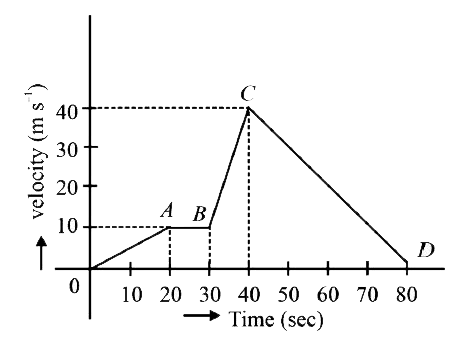
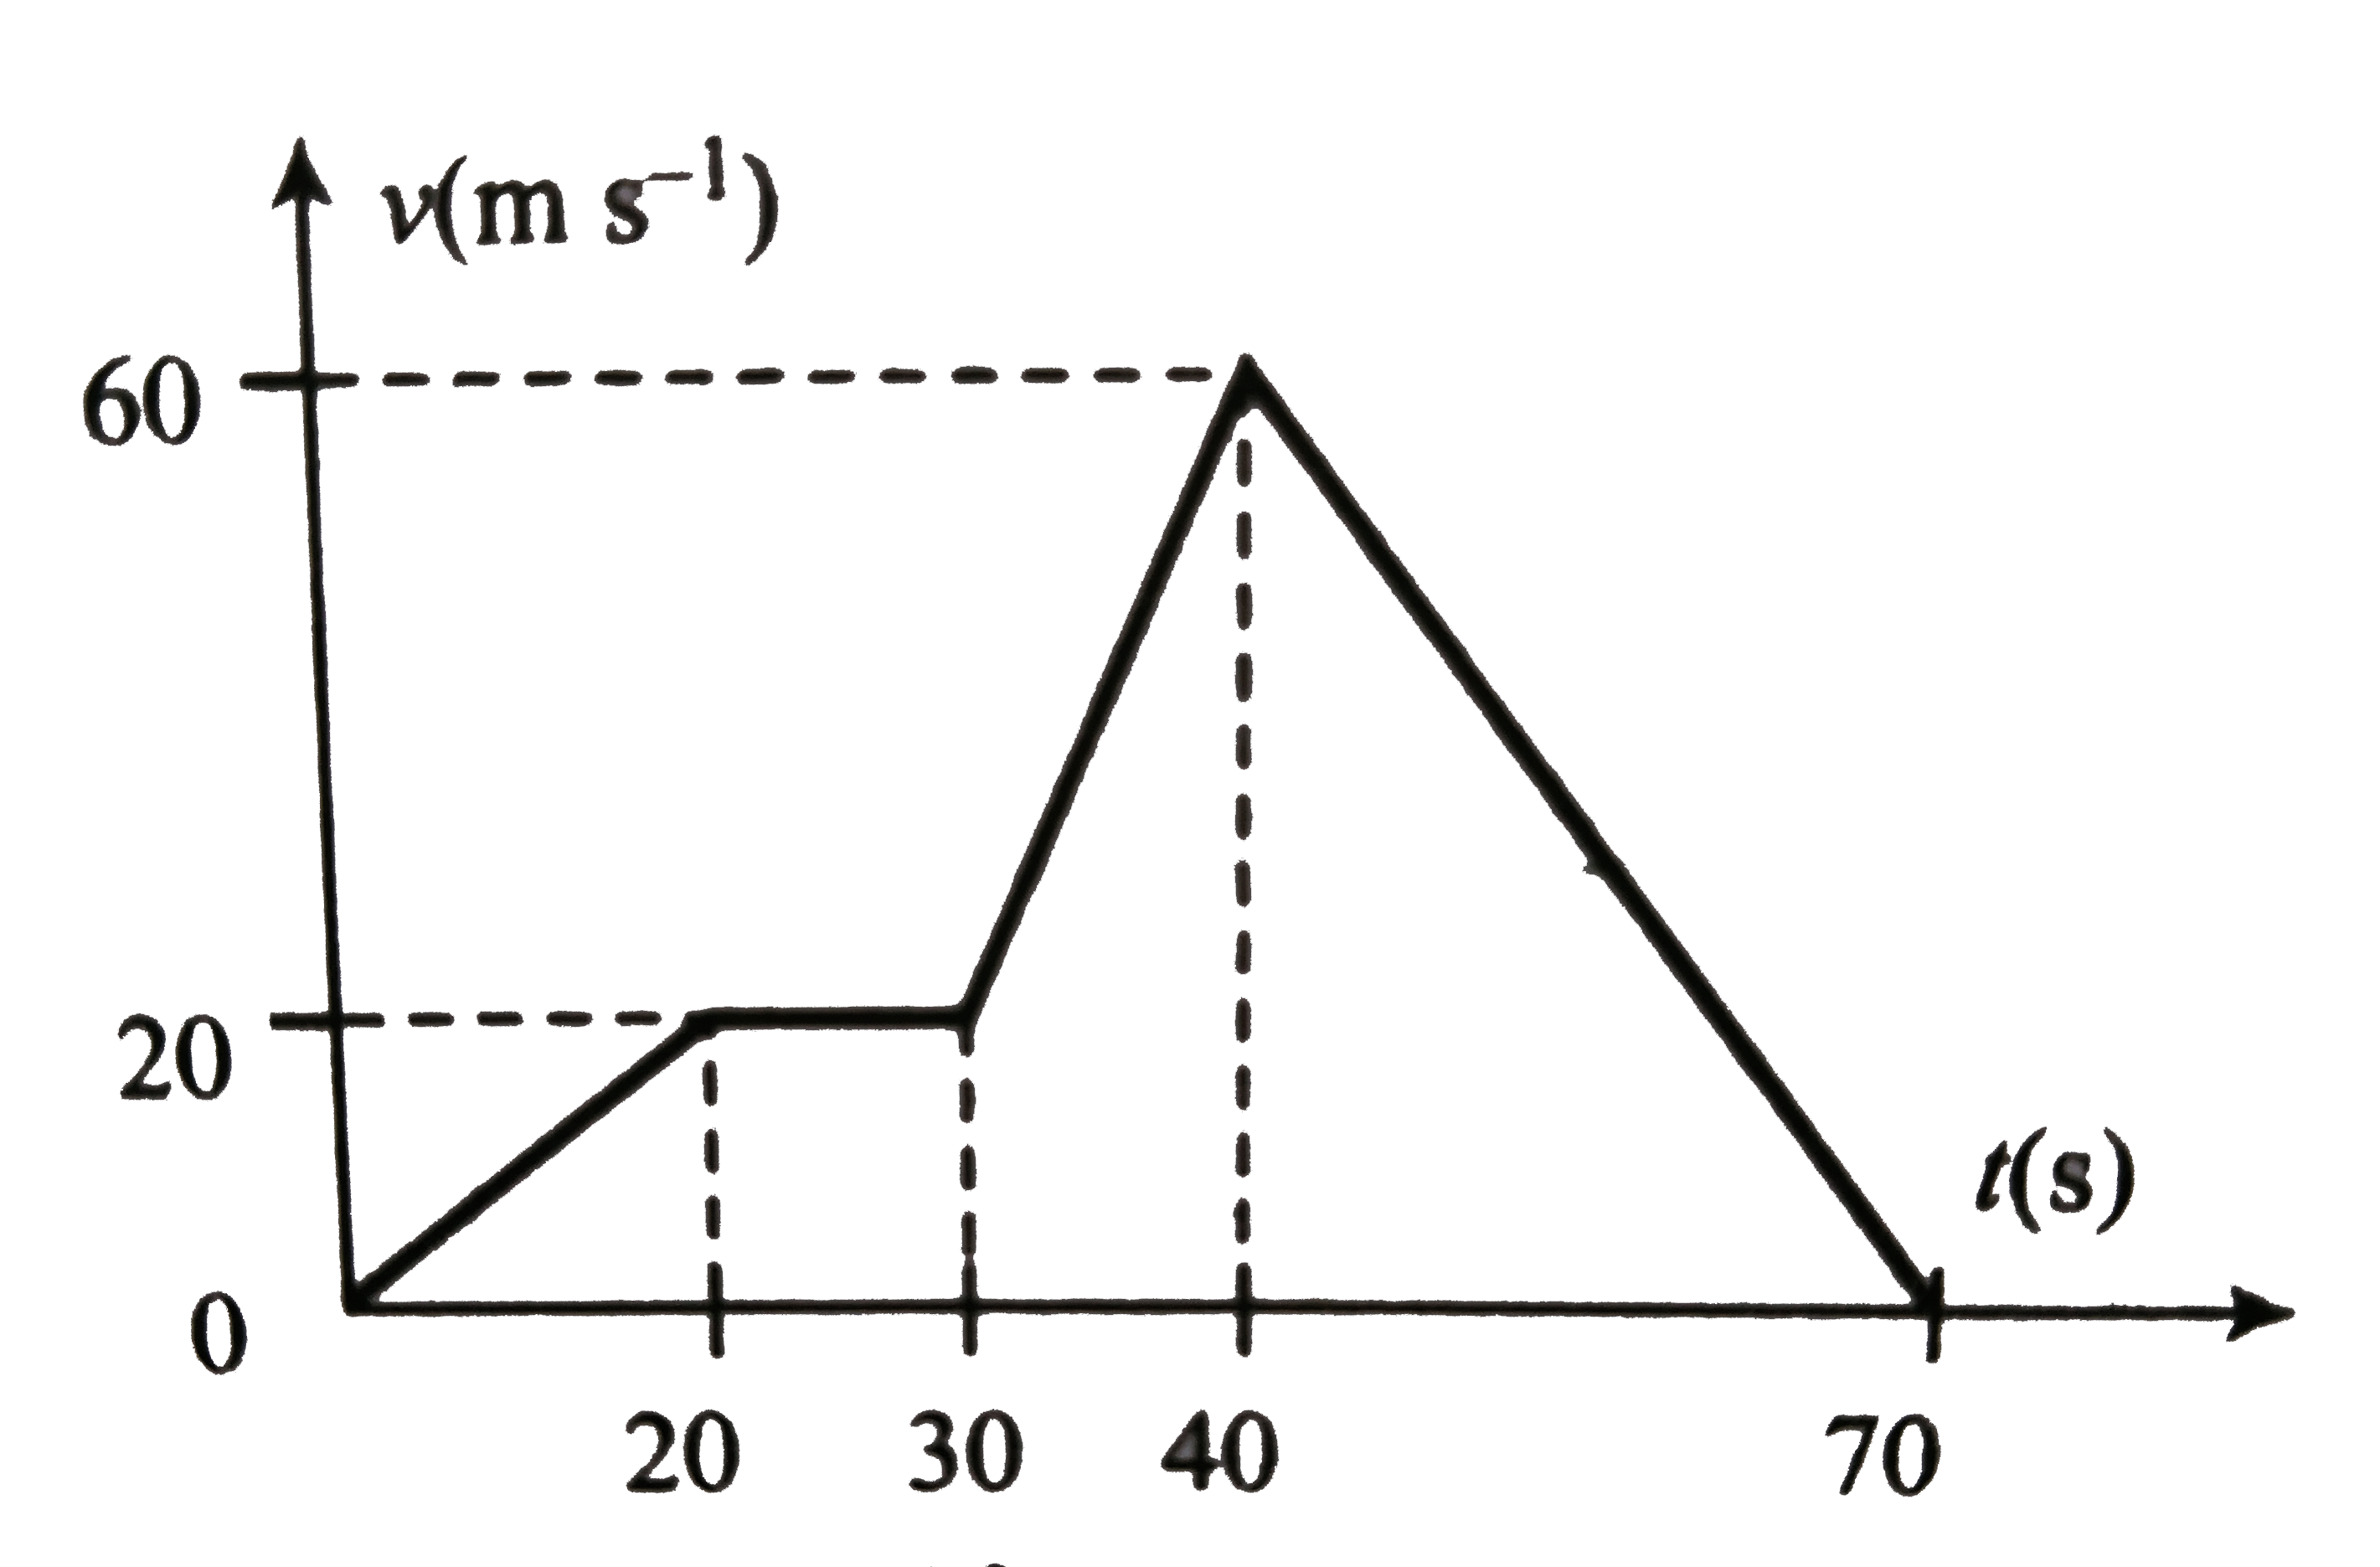
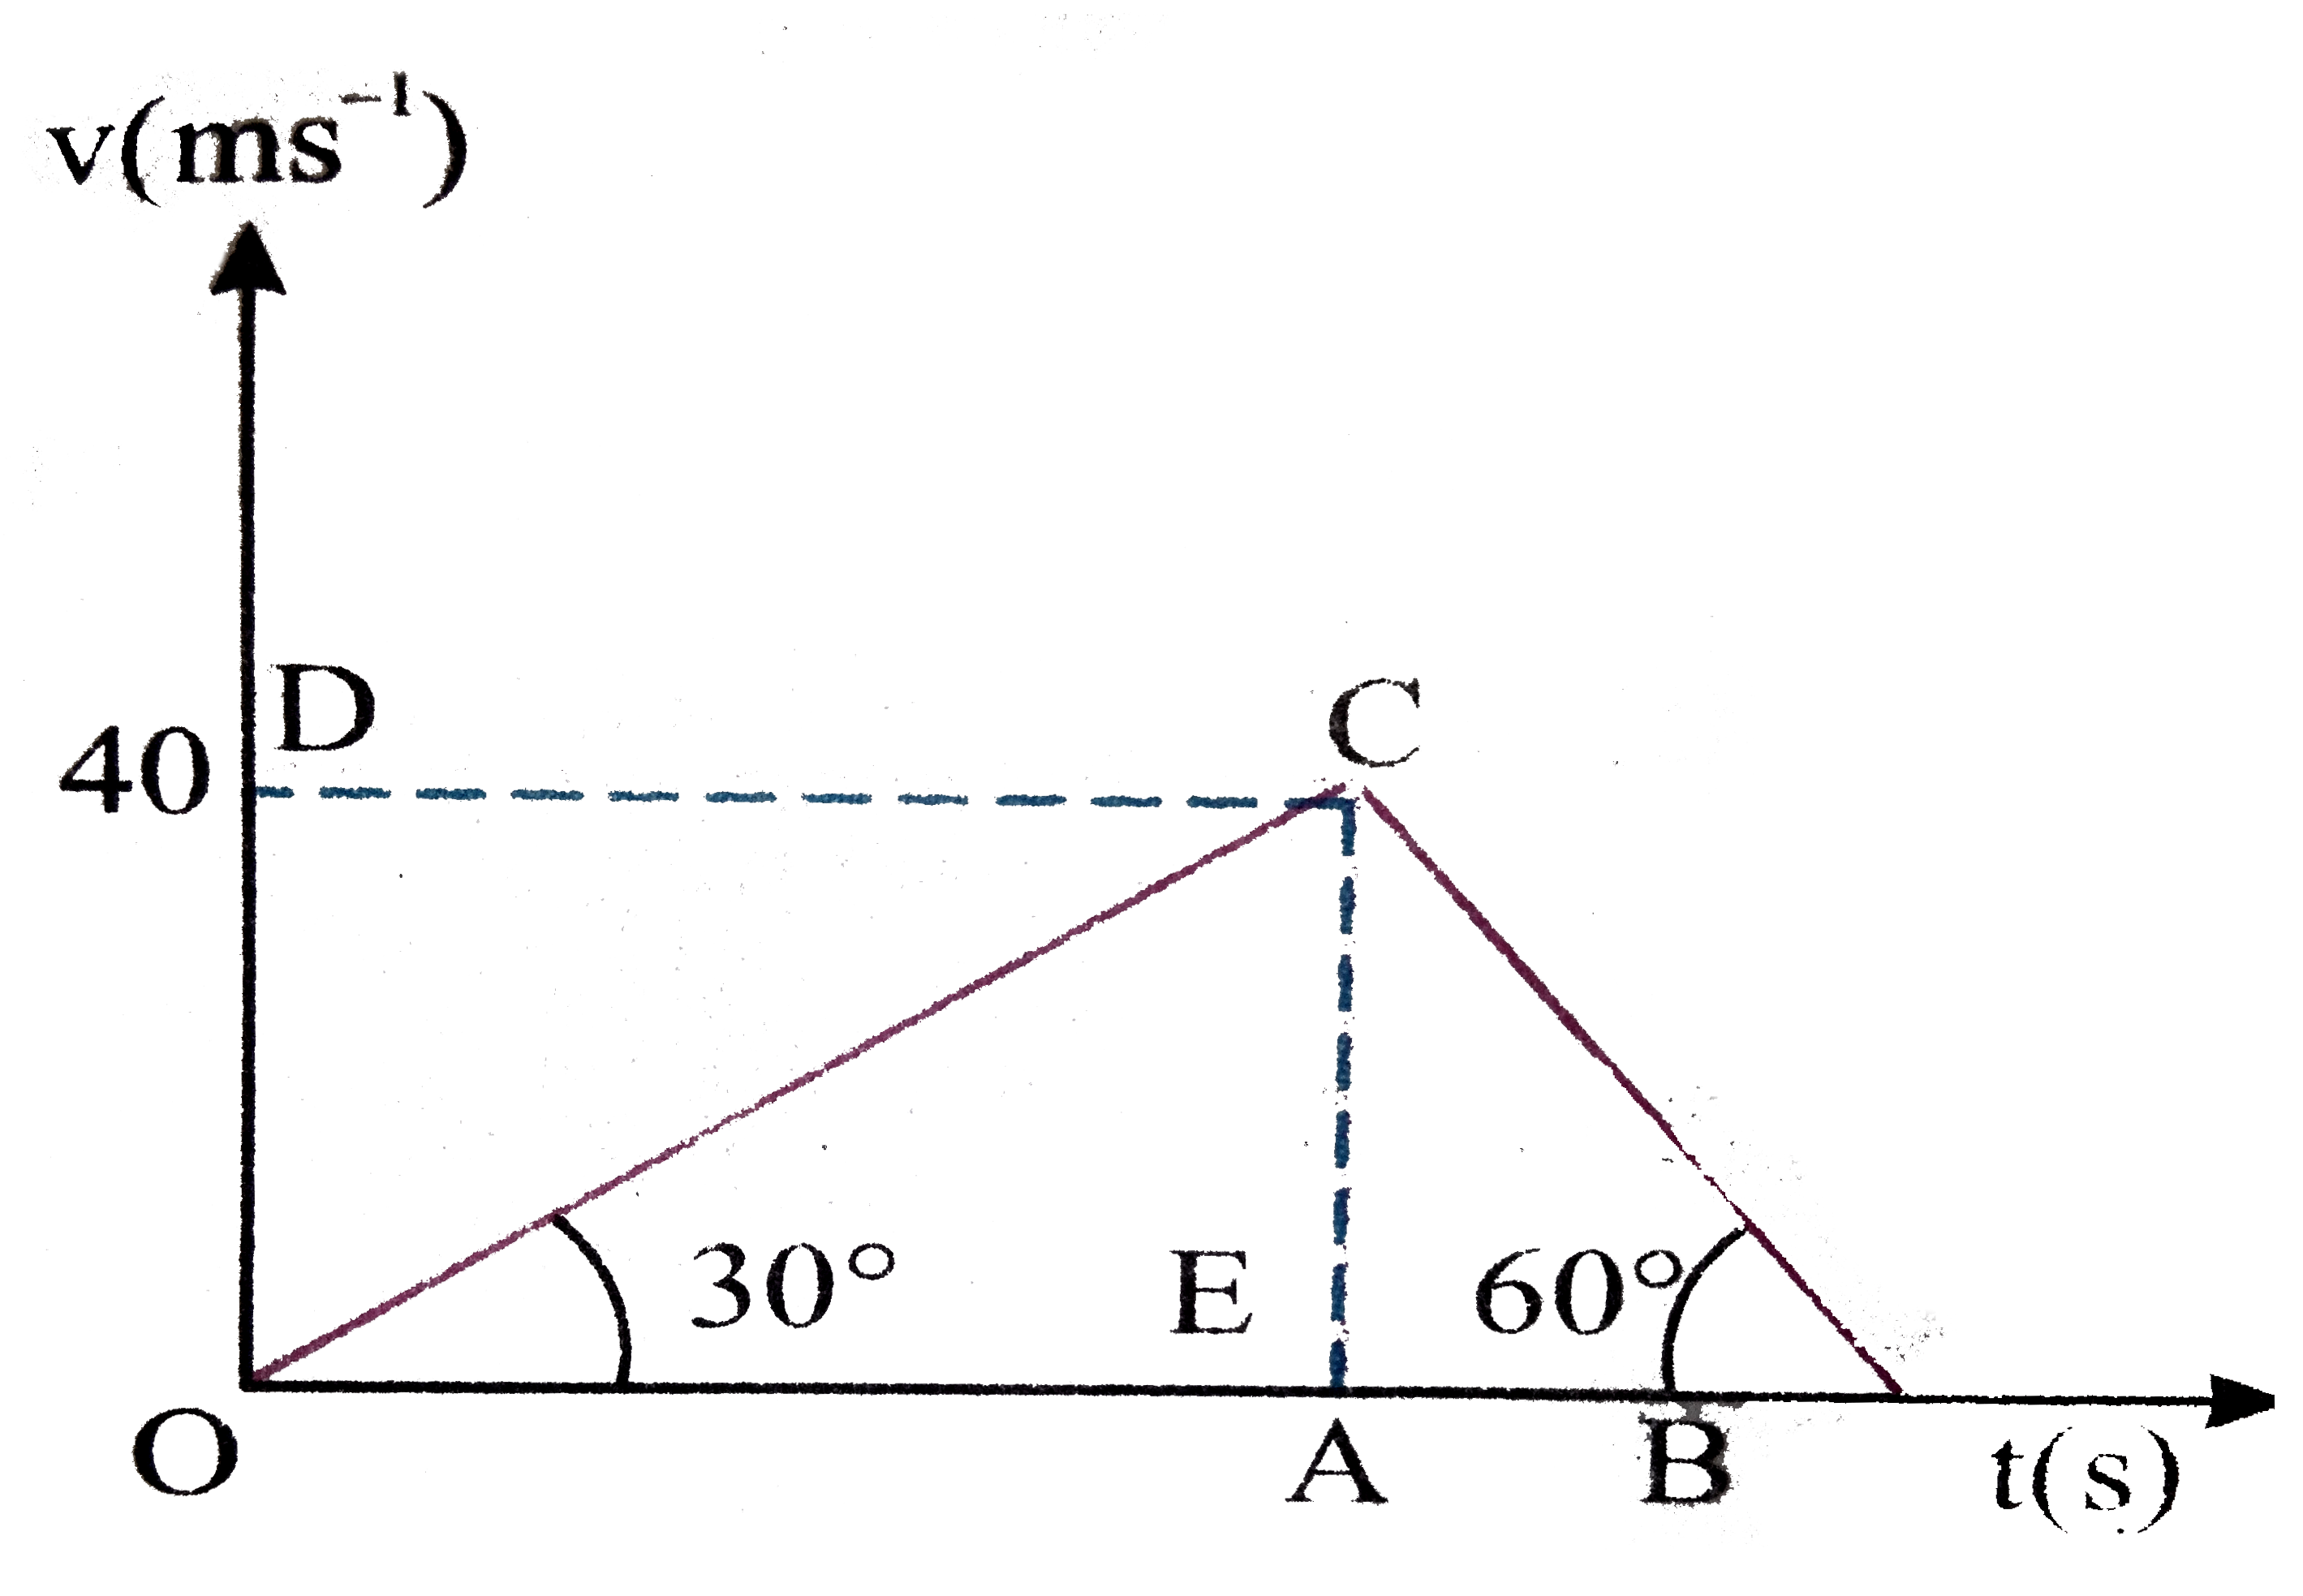
From the above velocity-time graph of a body, identify the interval of time in which the acceleration is maximum. The distance travelled by the body in this interval be Xm. Then what is x10 ?
Video Solution
Text Solution
The correct Answer is:25.00
Highest possible acceleration is from B to C.
∴amax= Slope of BC curve =ΔvΔt
=40−1040−30=3ms−2
smax=v2−u22amax=402−1022×3=250m
|
Topper's Solved these Questions
Similar Questions
Knowledge Check
The velocity-time (v – t) graph of a body is shown in the figure. For the intervals OP and PQ, the ratio of the distances covered is
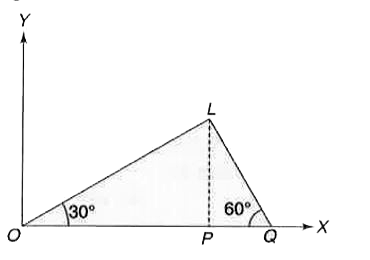 A1:3B√3:1C3:1D√3:2
In the following velocity -time graph ,the distance travelled by the body in meres is :
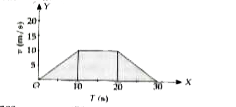 A200B250C300D400
The velocity-time graph of a body is given in. The maximum acceleration in ms−1 is .
 .A4B3C2D1
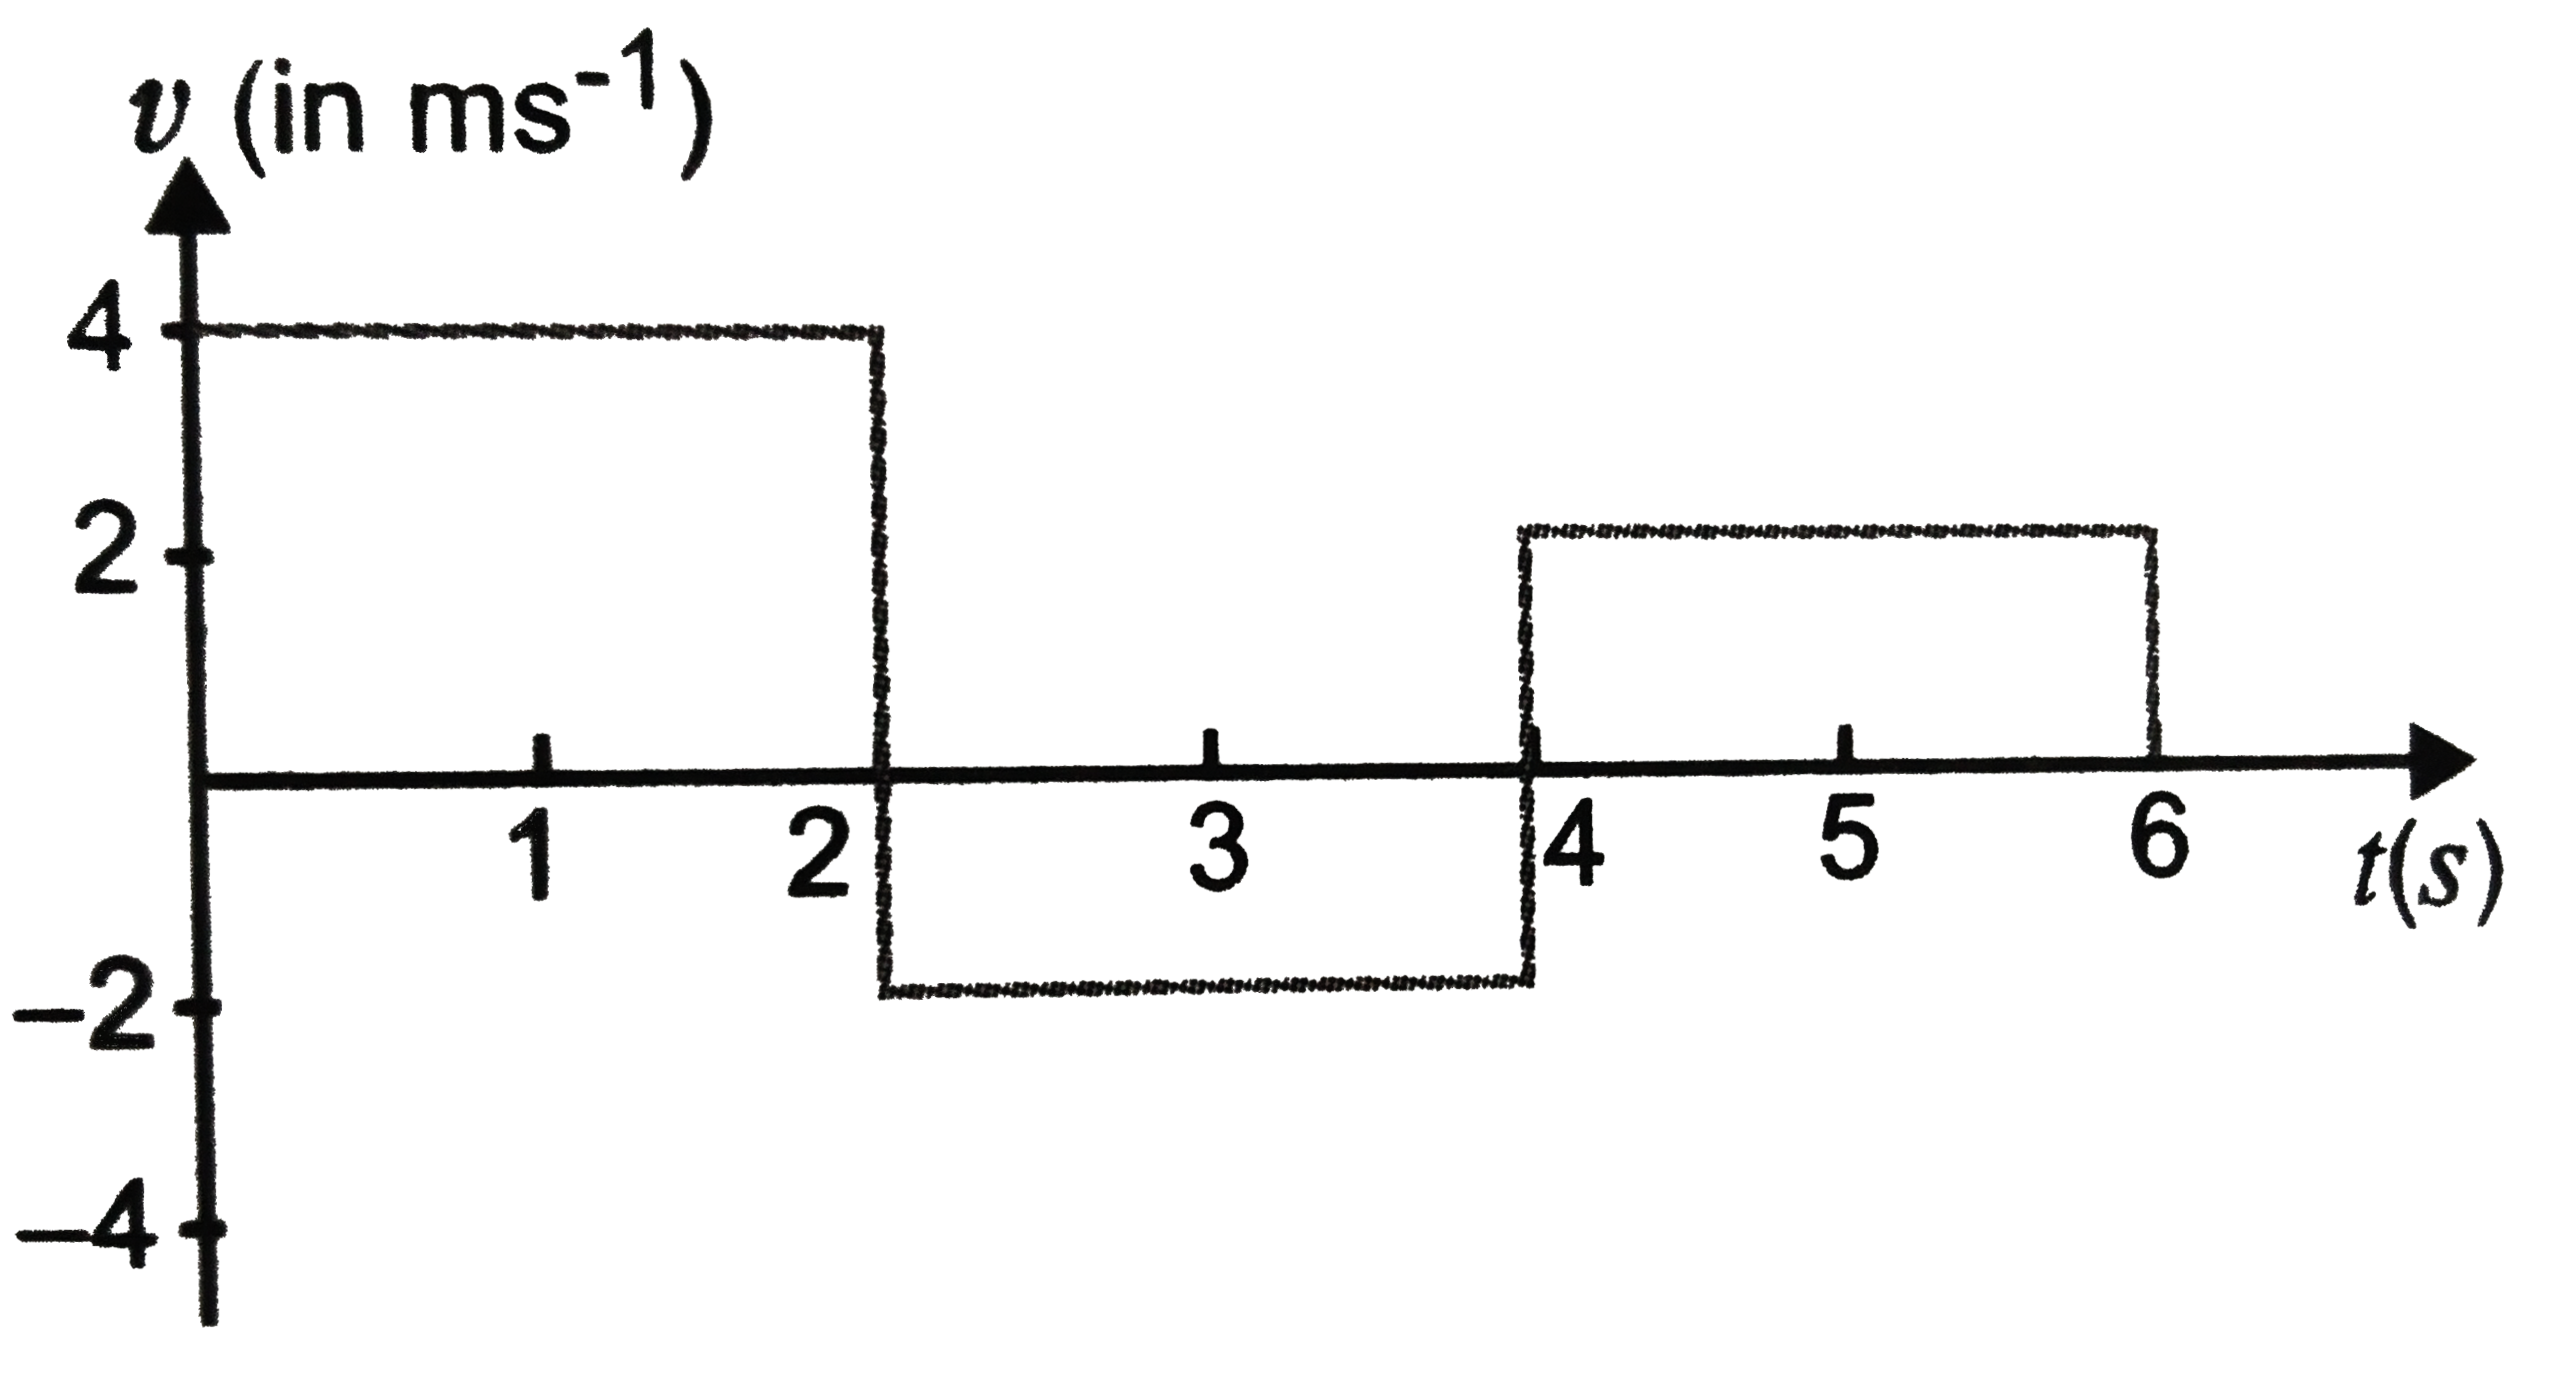
The velocit-time graph of a body moving in a straight line is shown in Fig. 2 (d) . 32. Find the displacement and the distance travelled by the body in 6seconds.
 .
.
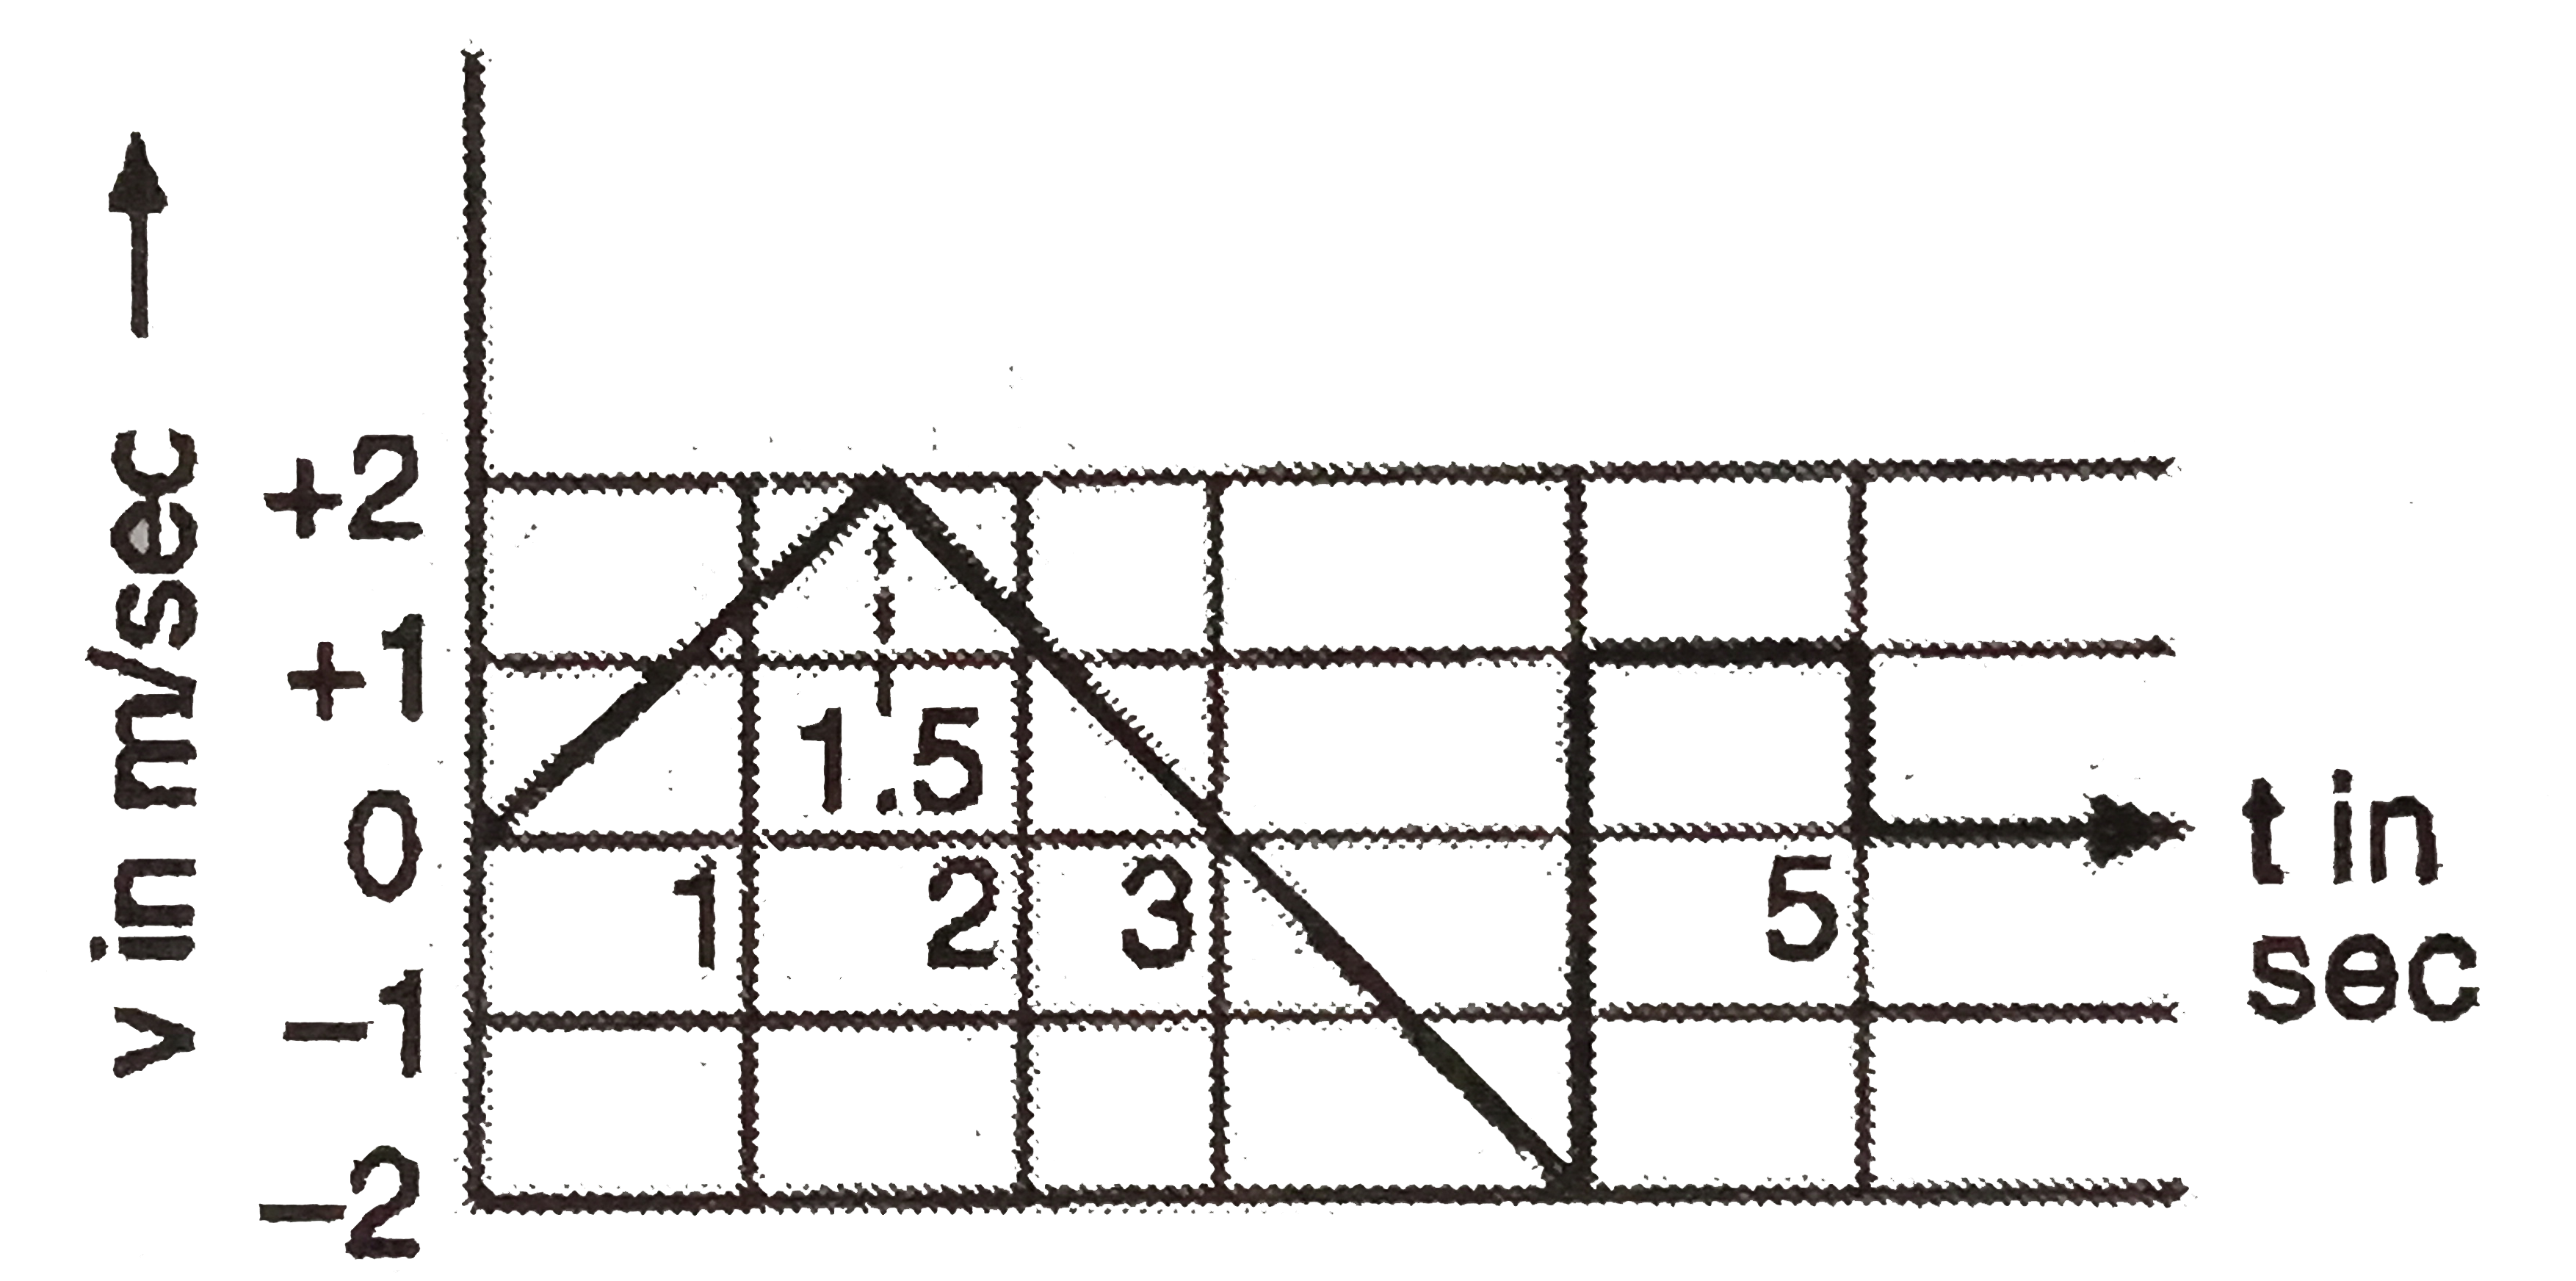
View SolutionThe velocity versus time graph of a body moving in a straight line is as follows. The distance travelled by the body is 5 sec is
View SolutionThe area under velocity-time graph for a particle in a given interval of time represents
View SolutionThe velocity - time graph of a body is given in figure below .
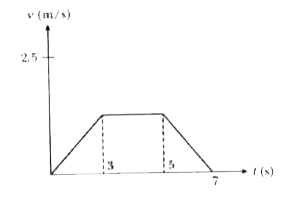
The acceleration-time graph of the motion of the body is
View SolutionThe velocity-time graph of a body is shown in figure. The ratio of magnitude of average acceleration during the intervals OA and AB is
View Solution


