A stone is thrown up in the air . It rises to a height h and then returns to the thrower. For the time that the stone is in air , sketch the following graphs : y versus t, v versus t, a versus t.
To solve the problem of sketching the graphs of displacement (y vs. t), velocity (v vs. t), and acceleration (a vs. t) for a stone thrown upwards, we can follow these steps:
Step 1: Understand the Motion
When a stone is thrown upwards, it rises to a maximum height (h) and then falls back down to the thrower. During this motion, the stone experiences a constant acceleration due to gravity acting downwards.
Step 2: Displacement vs. Time (y vs. t)
1. Initial Phase (Going Up): As the stone is thrown upwards, its displacement from the starting point increases. The graph starts from the origin (0,0) and curves upwards.
2. At Maximum Height: At the peak (height h), the displacement is at its maximum.
3. Final Phase (Coming Down): After reaching the maximum height, the stone starts descending, and the displacement decreases back to zero when it returns to the thrower. The graph curves back downwards.
Graph Shape: The displacement vs. time graph is a parabolic curve that opens upwards.
Step 3: Velocity vs. Time (v vs. t)
1. Initial Phase (Going Up): The stone is thrown upwards with an initial positive velocity. As it rises, the velocity decreases due to the acceleration of gravity acting in the opposite direction.
2. At Maximum Height: At the highest point, the velocity becomes zero.
3. Final Phase (Coming Down): After reaching the maximum height, the stone begins to fall, and the velocity becomes negative as it accelerates downwards.
Graph Shape: The velocity vs. time graph is a straight line that starts from a positive value, slopes down to zero, and then continues into negative values.
Step 4: Acceleration vs. Time (a vs. t)
1. Constant Acceleration: The acceleration due to gravity (g) is constant throughout the motion and acts downwards.
2. Value of Acceleration: The value of acceleration is approximately -9.8 m/s² (negative indicates the downward direction).
Graph Shape: The acceleration vs. time graph is a horizontal line at -9.8 m/s².
Summary of Graphs
1. Displacement vs. Time (y vs. t): Parabolic curve opening upwards.
2. Velocity vs. Time (v vs. t): Straight line sloping downwards to zero and then into negative values.
3. Acceleration vs. Time (a vs. t): Horizontal line at -9.8 m/s².
When a stone is thrown upwards, it rises to a maximum height (h) and then falls back down to the thrower. During this motion, the stone experiences a constant acceleration due to gravity acting downwards.
1. Initial Phase (Going Up): As the stone is thrown upwards, its displacement from the starting point increases. The graph starts from the origin (0,0) and curves upwards.
2. At Maximum Height: At the peak (height h), the displacement is at its maximum.
3. Final Phase (Coming Down): After reaching the maximum height, the stone starts descending, and the displacement decreases back to zero when it returns to the thrower. The graph curves back downwards.
1. Initial Phase (Going Up): The stone is thrown upwards with an initial positive velocity. As it rises, the velocity decreases due to the acceleration of gravity acting in the opposite direction.
2. At Maximum Height: At the highest point, the velocity becomes zero.
3. Final Phase (Coming Down): After reaching the maximum height, the stone begins to fall, and the velocity becomes negative as it accelerates downwards.
1. Constant Acceleration: The acceleration due to gravity (g) is constant throughout the motion and acts downwards.
2. Value of Acceleration: The value of acceleration is approximately -9.8 m/s² (negative indicates the downward direction).
1. Displacement vs. Time (y vs. t): Parabolic curve opening upwards.
2. Velocity vs. Time (v vs. t): Straight line sloping downwards to zero and then into negative values.
3. Acceleration vs. Time (a vs. t): Horizontal line at -9.8 m/s².
Similar Questions
Knowledge Check
A stone is dropped into a pond from the top of the tower of height h. If v is the speed of sound in air, then the sound of splash will be heard at the top of the tower after a time
A√2hg+hvB√2hg−hvC√2hgD√2hg+2hv
A ball is dropped from a height of 19.6 m above the ground. It rebounds from the ground and raises itself up to the same height. Take the starting point as the origin and vertically downward as the positive X-axis. Draw approximate plots of x versus t, v versus t and a versus t. Neglect the small interval during which the ball was in contact with the ground.
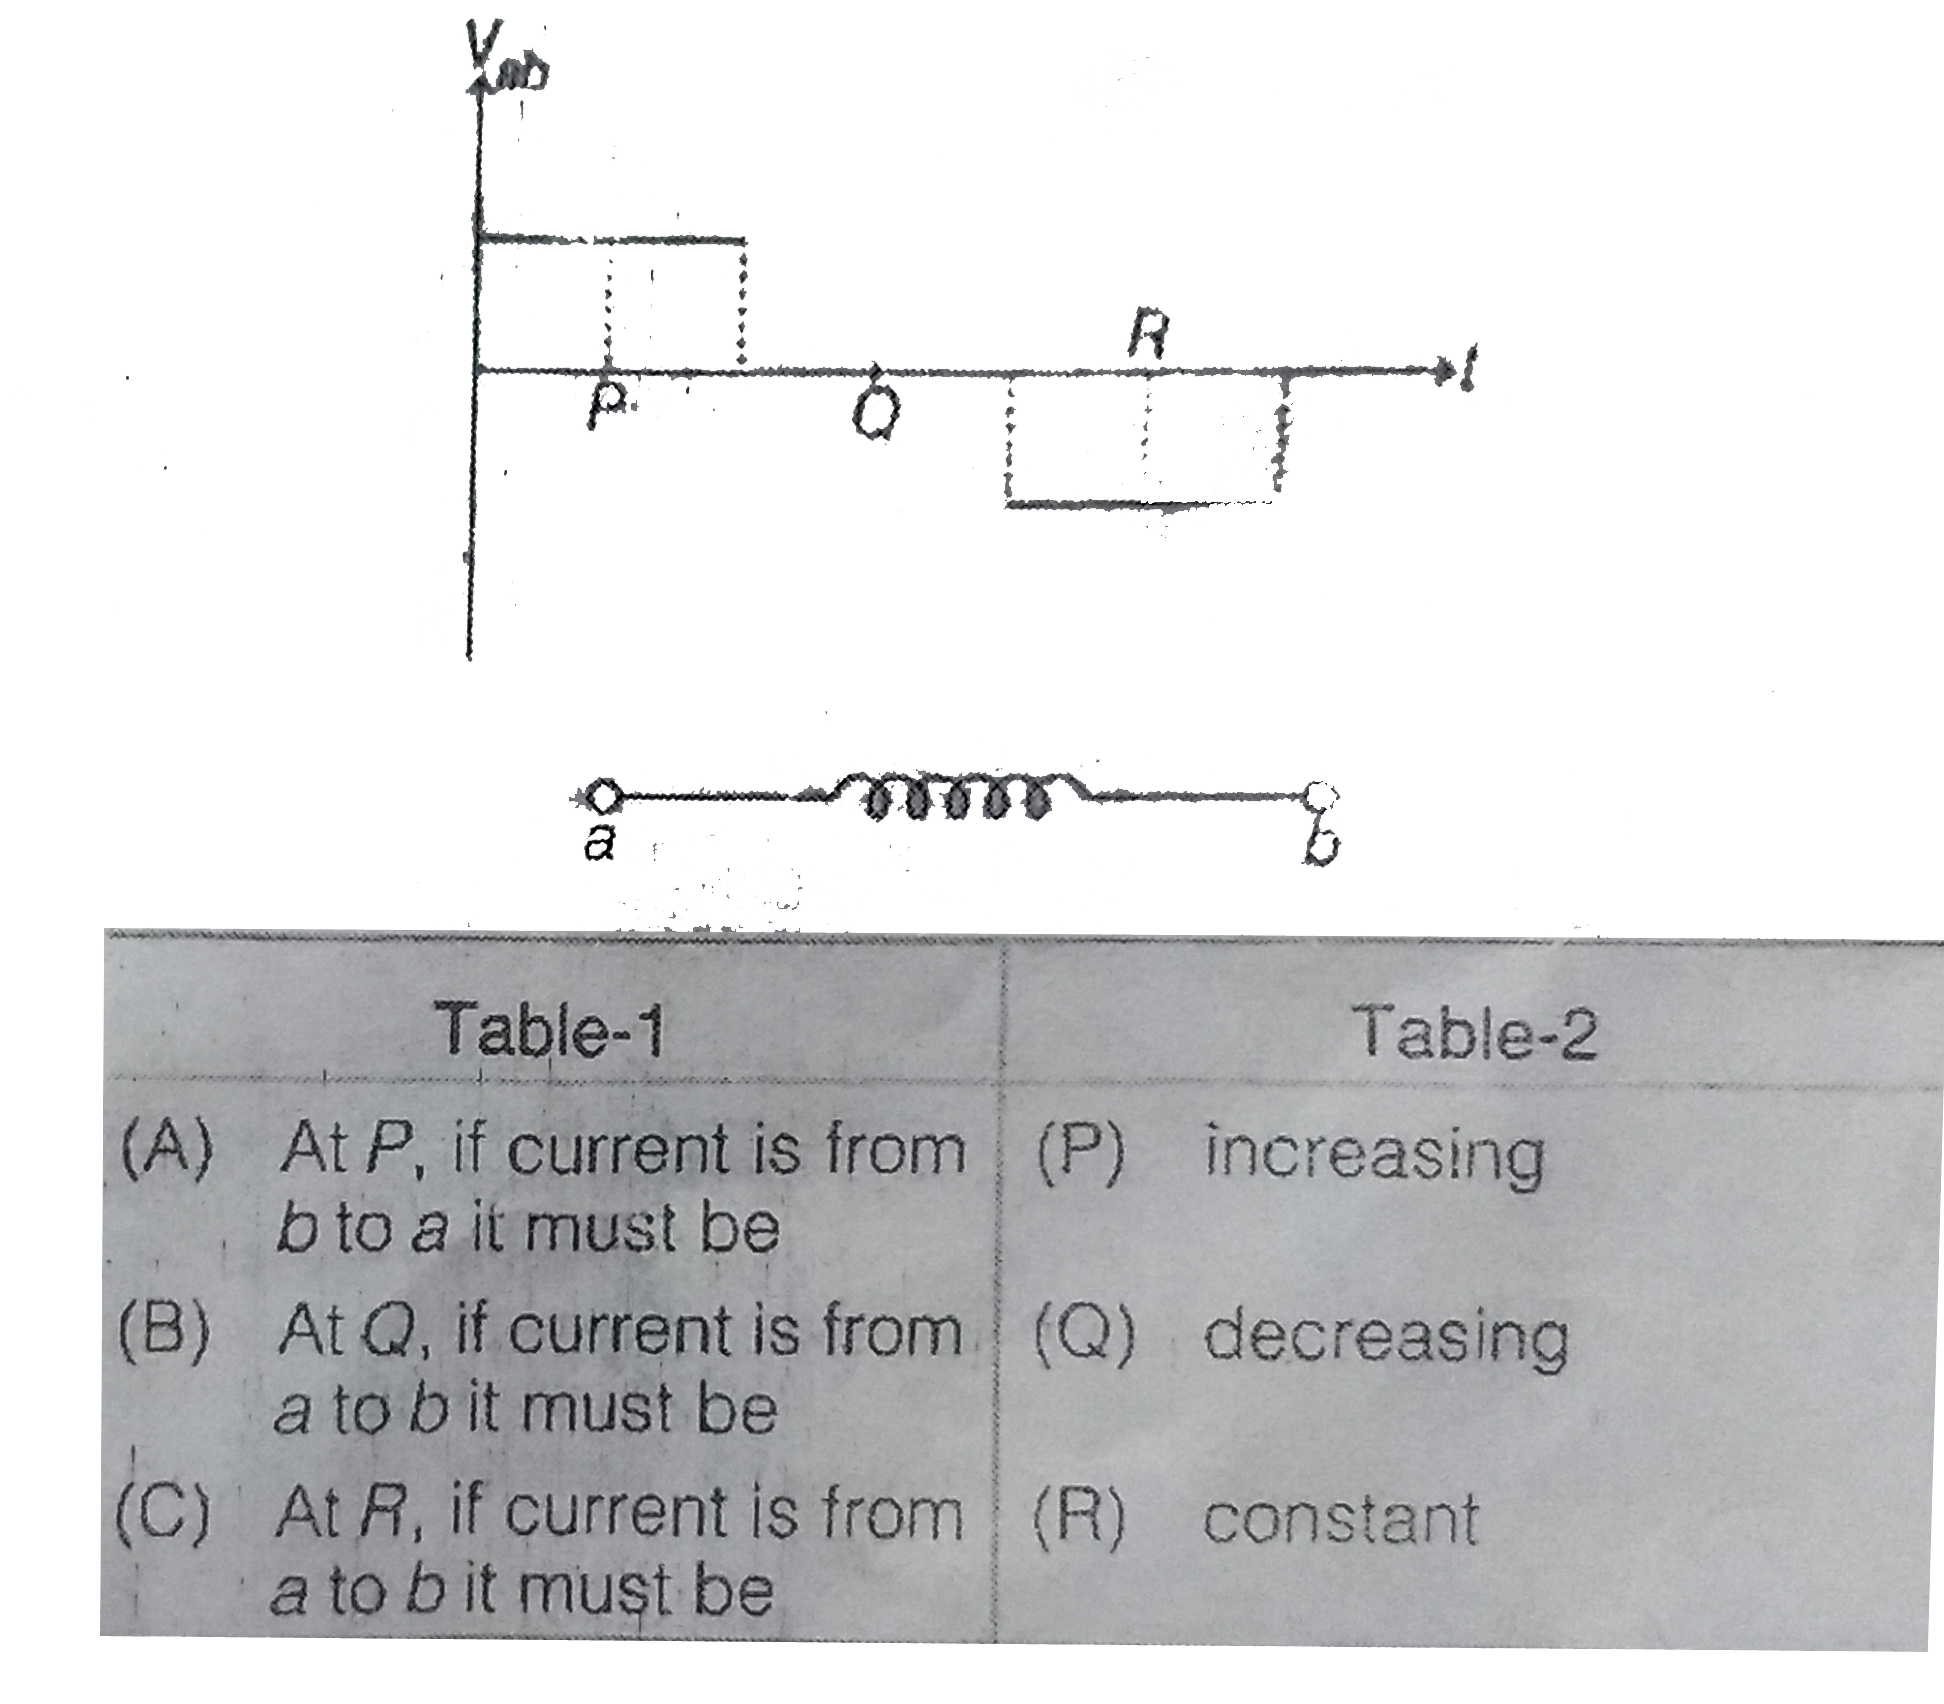
View SolutionIn the figure Vab versus time graph along an inductor is shown. Match the following

View SolutionA particle is thrown vertically upwards with a velocity v. It returns to the ground in time T. which of the following graphs correctly represents the motion ?
View SolutionA particle moving along straight line has velocity v=μs where s is in the displacement . If s=s0 then which of the following graph best represent s versus t
View SolutionA heavy stone is thrown from a cliff of height h with a speed v. The stone will hit the ground with maximum speed if it is thrown
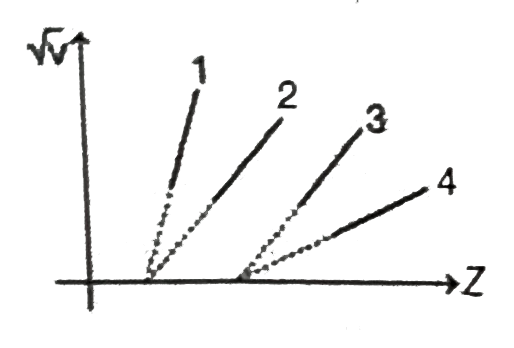
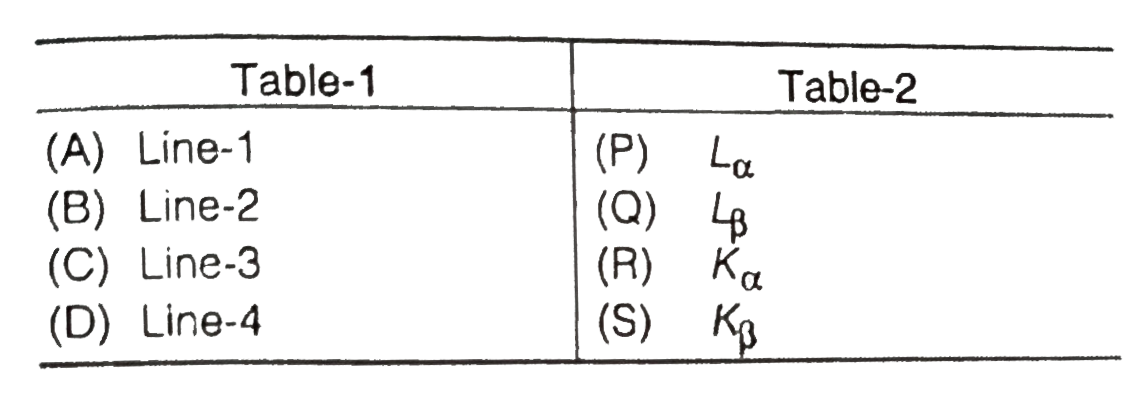
View Solution√v versus Z graph for dcharacteristic X-rays is as shown in figure. Match the following


View SolutionFrom the top of a tower, a stone is thrown up and it reaches the ground in time t1A second stone is thrown down with the same speed and it reaches the ground in time t2 A third stone is released from rest and it reaches the ground in time The correct relation between t1,t2 and t3 is :
View Solution