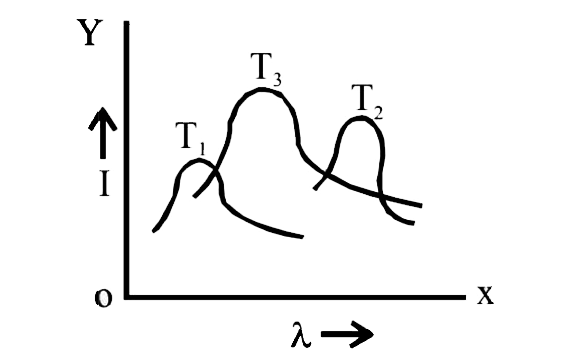
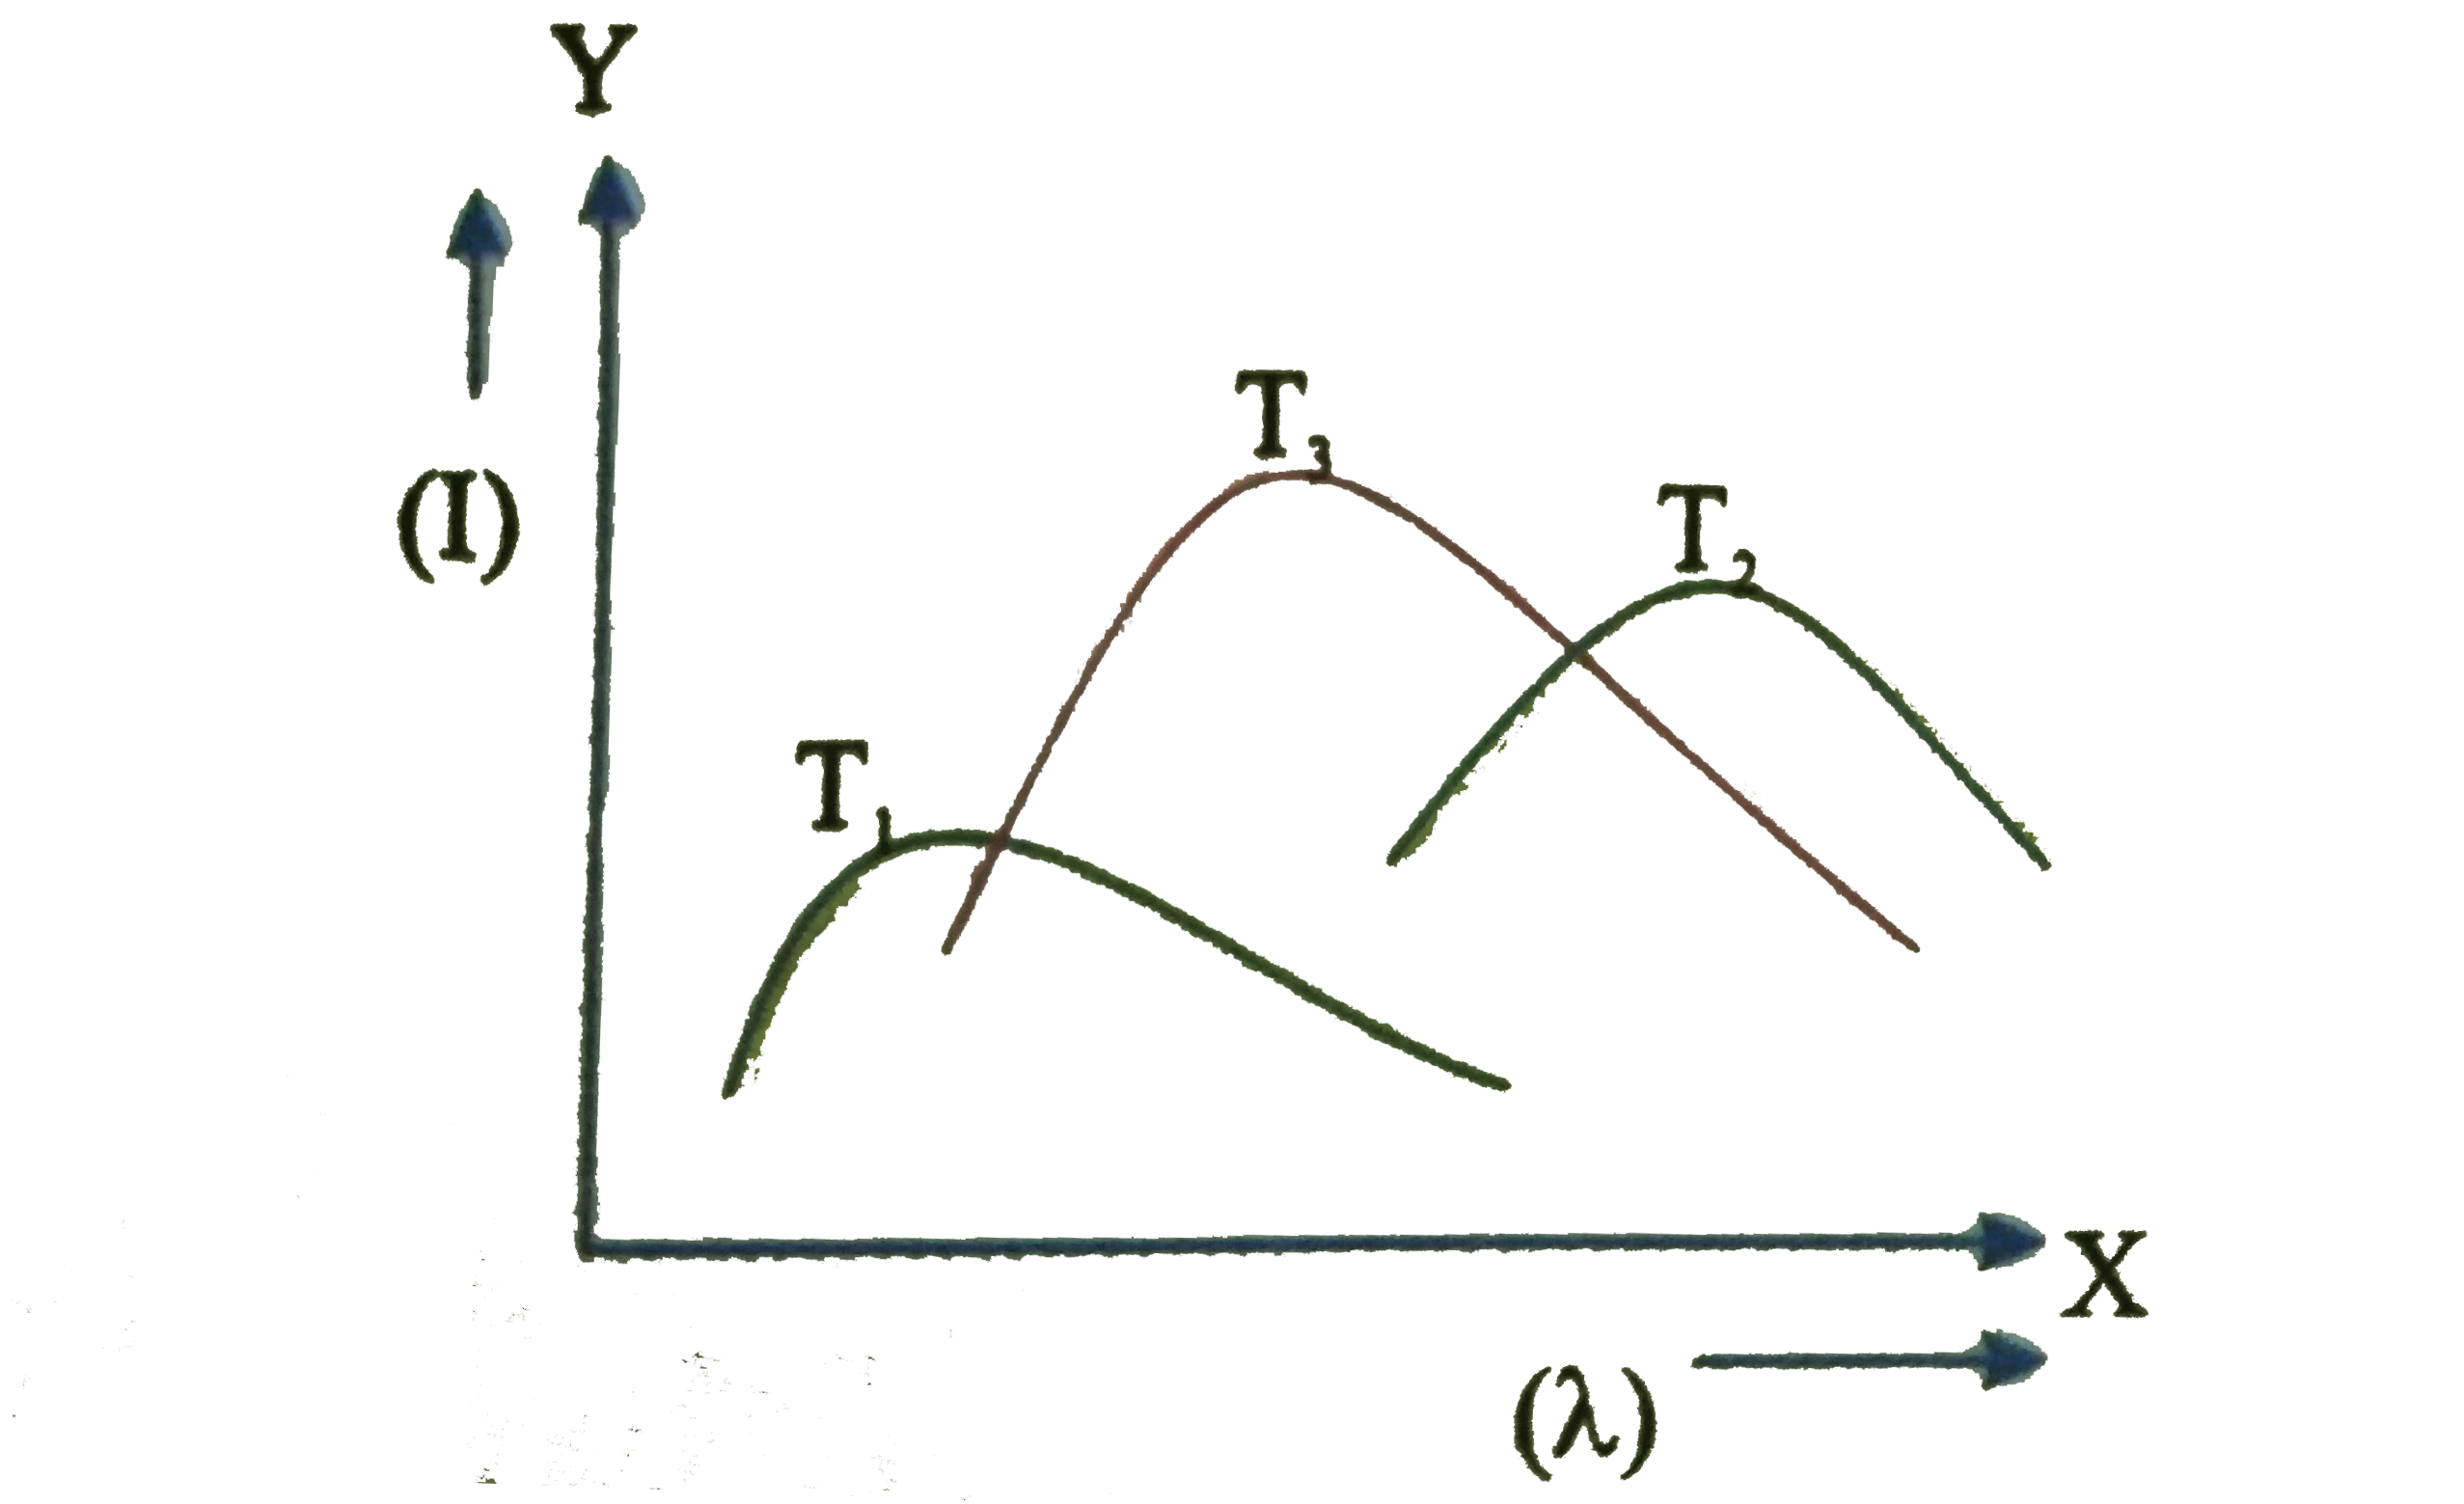
The plots of intensity versus wavelength , for three black bodies at temperatures T1,T2andT3 , respectively , are as shown . Their temperature are such that

T1>T2>T3
T1>T3>T2
T2>T3>T1
T2>T3>T1
The correct Answer is:B
Step by step video solution for The plots of intensity versus wavelength , for three black bodies at temperatures T_1 ,T_2 and T_3 , respectively , are as shown . Their temperature are such that by Physics experts to help you in doubts & scoring excellent marks in Class 11 exams.
Updated on:21/07/2023Similar Questions
The plots of intensity versus wavelength for three black bodies at temperature T1,T2andT3 respectively are as shown. Their temperatures are such that
View SolutionThe plots of intensity versus wavelength for three black bodies at temperatures T1,T2 and T3 respectively are shown in Their temperatures are shown in How their temperatures are related ?
 .
.
View Solution
Knowledge Check
The plots of intensity versus wavelength fro three black bodies at temperatures T1,T2 and T3 respectively and shown in Fig. 15.11.1. Their temperatures are such that
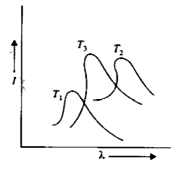 AT1>T2>T3BT1>T3>T2CT2>T3>T1DT3>T2>T1
Three isothermal plots (P versus V) A, B and C are plotted at three temperature T1,T2andT3 respectively
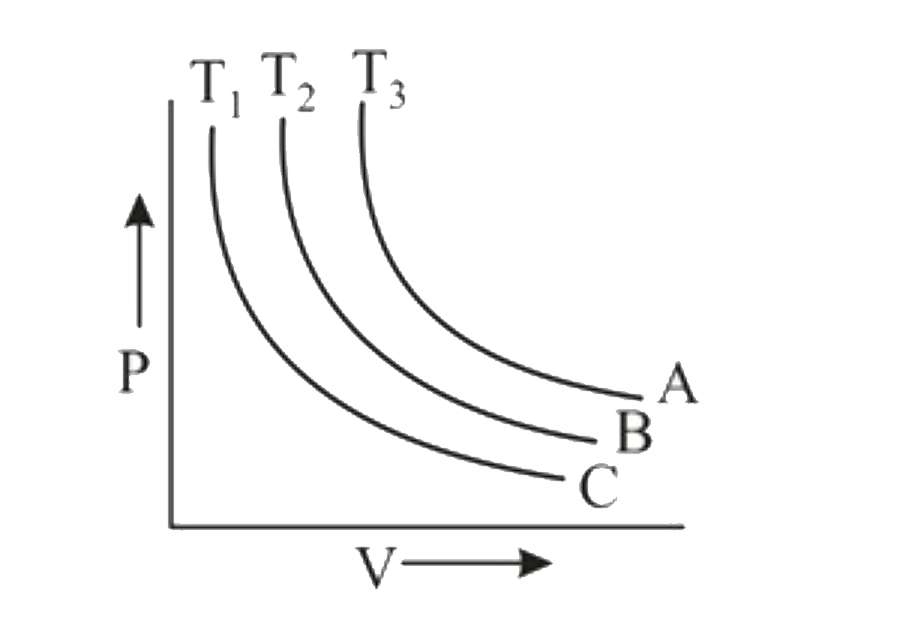
The correct order of the temperature will be
View Solution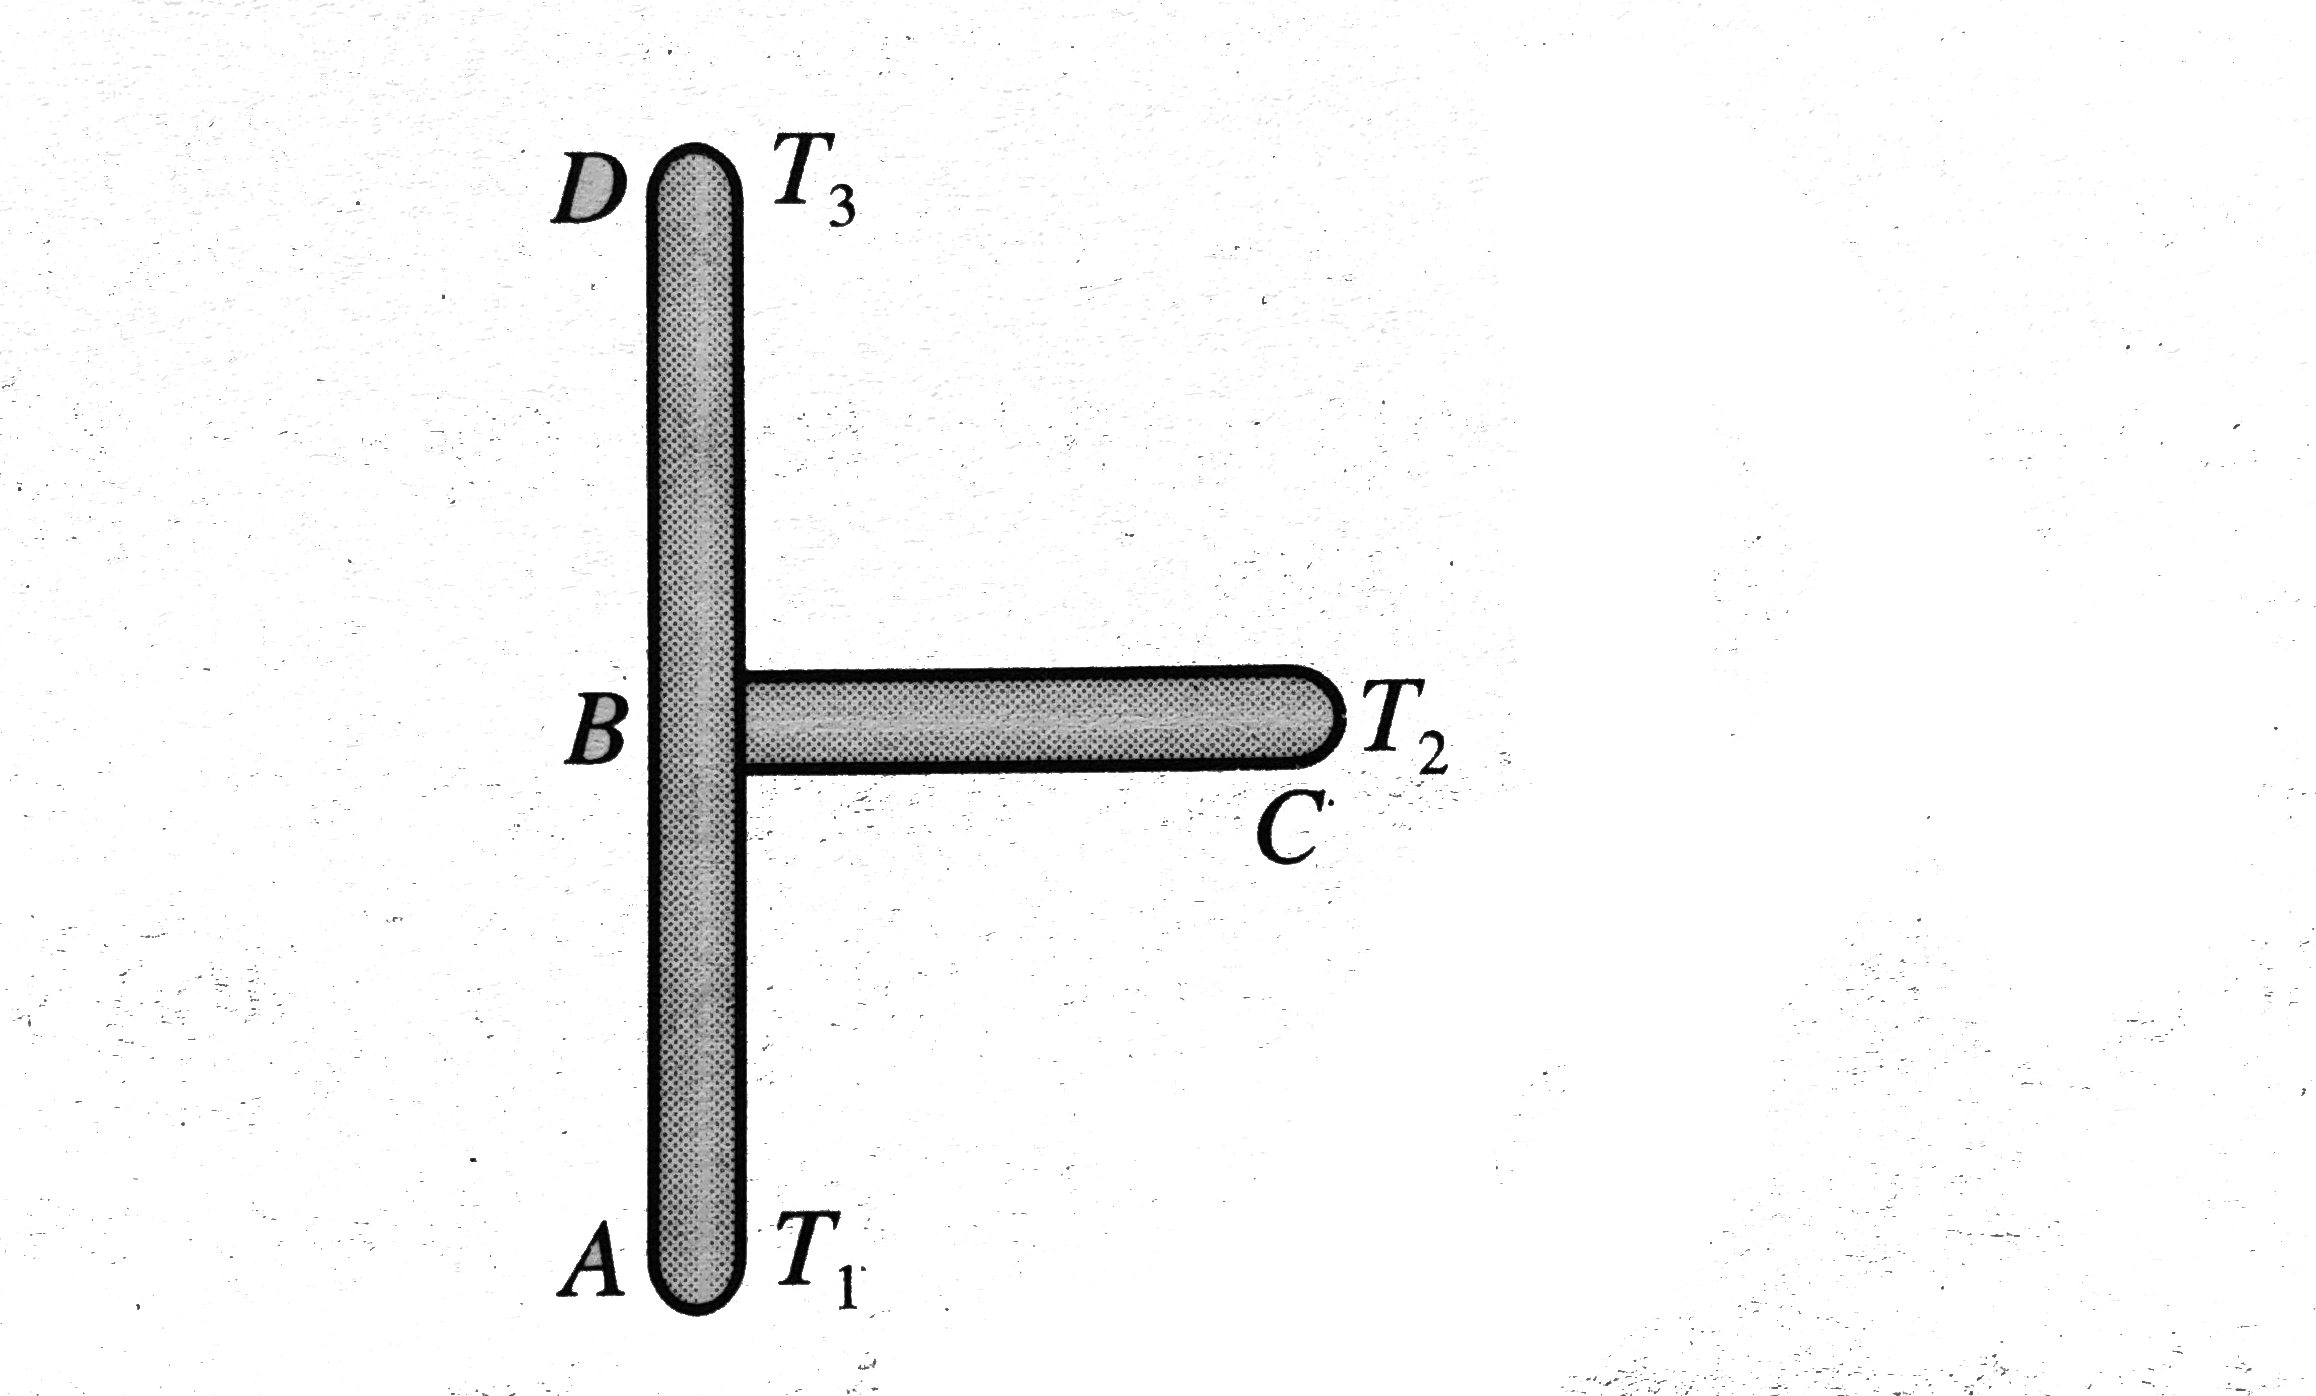
Three rods AB, BC and BD having thermal conductivities in the ratio 1:2:3 and lengths in the ratio 2:1:1 are joined as shown in Fig. The ends A, C and D are at temperature T1,T2 and T3 respectively Find the temperature of the junction B. Assume steady state.
View SolutionThree liquids with masses m1,m2,m3 are throughly mixed. If their specific heats are c1,c2,c3 and their temperature T1,T2,T3, respectively, then the temperature of the mixture is
View SolutionEqual volumes of three liquids of densities ρ1,ρ2 and ρ3, specific heat capacities c1,c2 and c3 and temperatures t1,t2 and t3, respectively are mixed together. What is the temperature of the mixture? Assume no changes in volume on mixing.
View SolutionThe plot of In k versus 1T is liner with slope of
View SolutionThe current - voltage graphs for a given metallic wire at two different temperatures T1andT2 are shown in the figure.
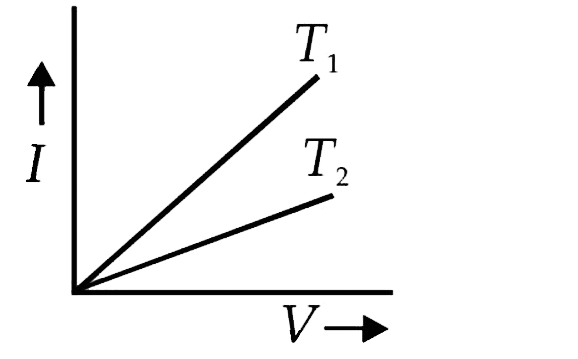
The temperature T2 is greater than T1.
View SolutionThe current - voltage graphs for a given metallic wire at two different temperatures T1andT2 are shown in the figure.

The temperature T2 is greater than T1.
View Solution
