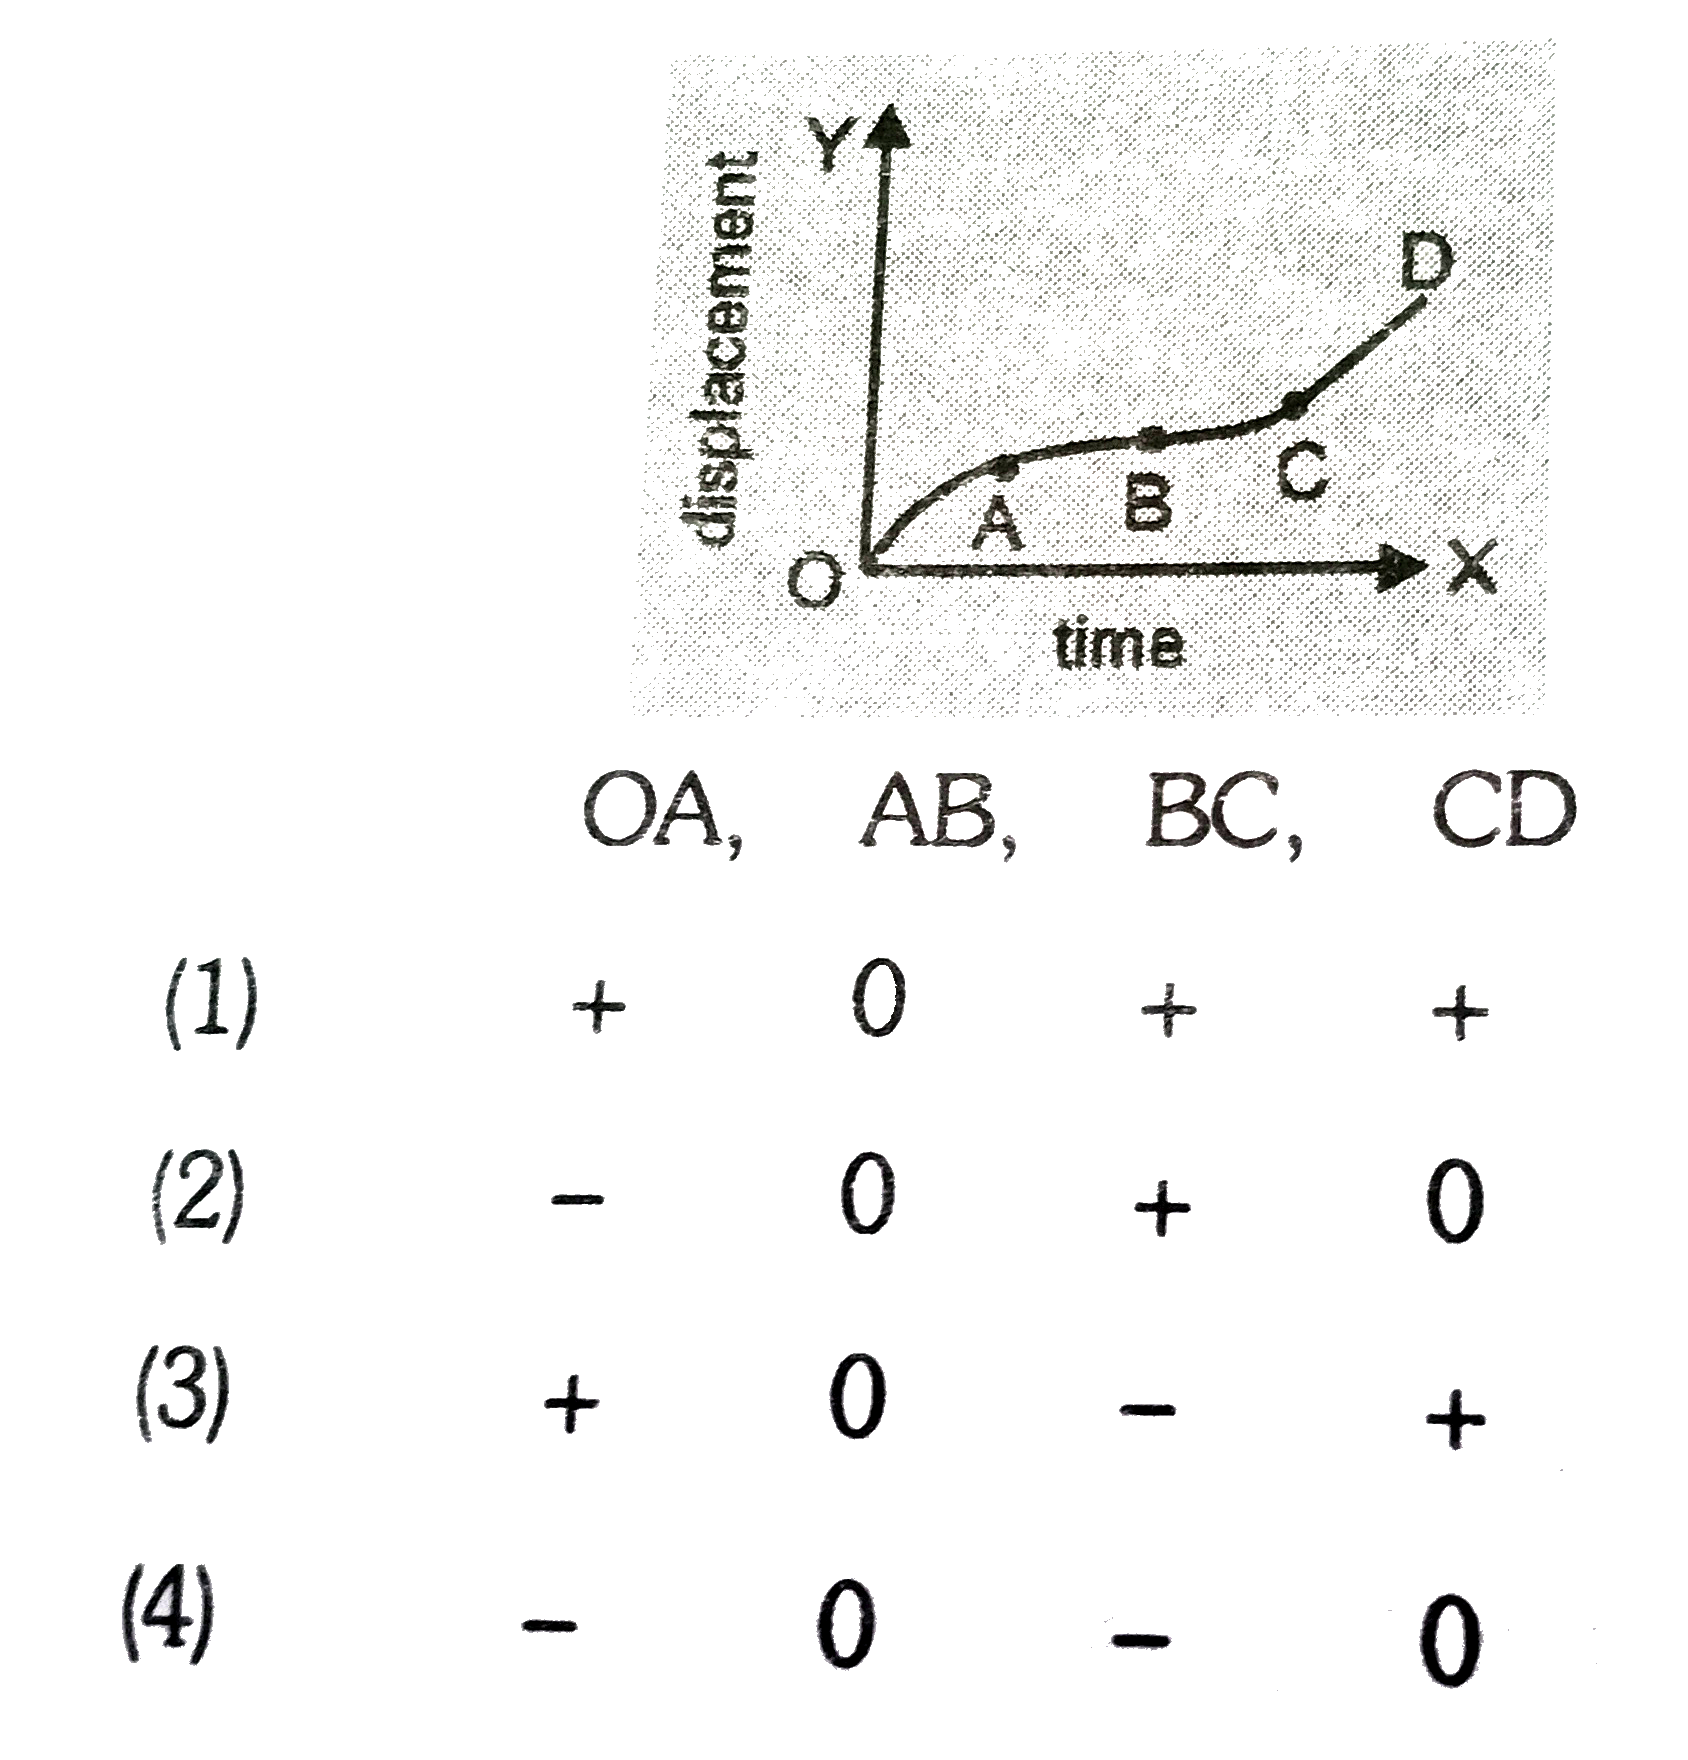
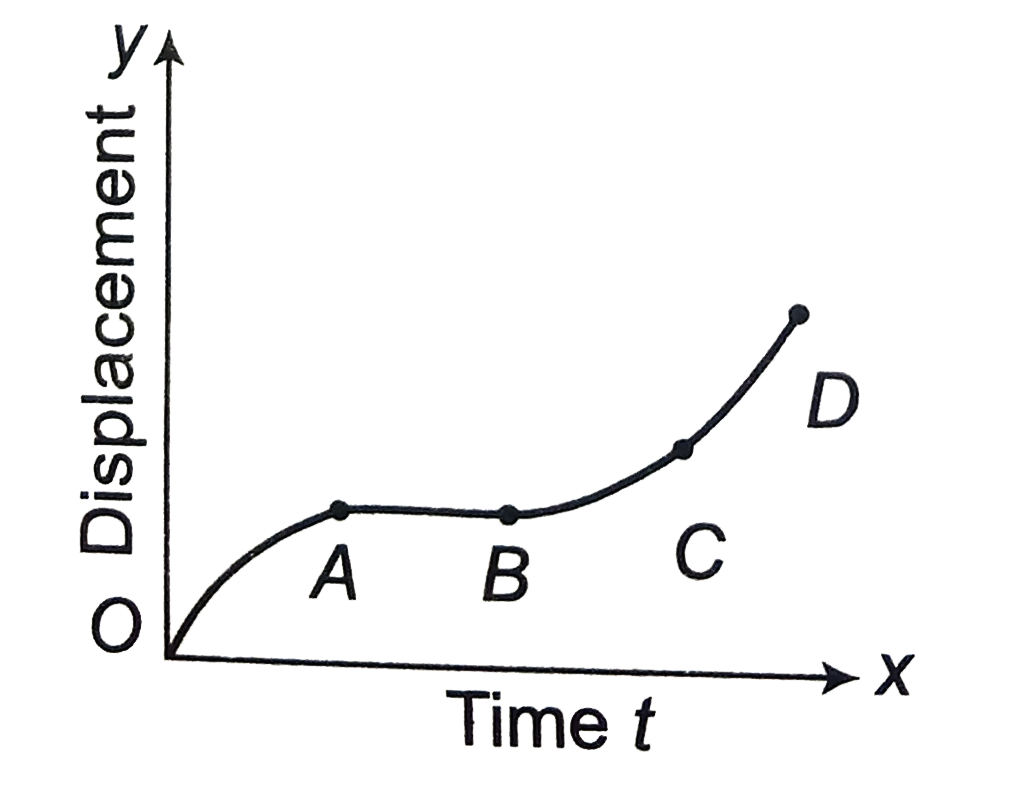
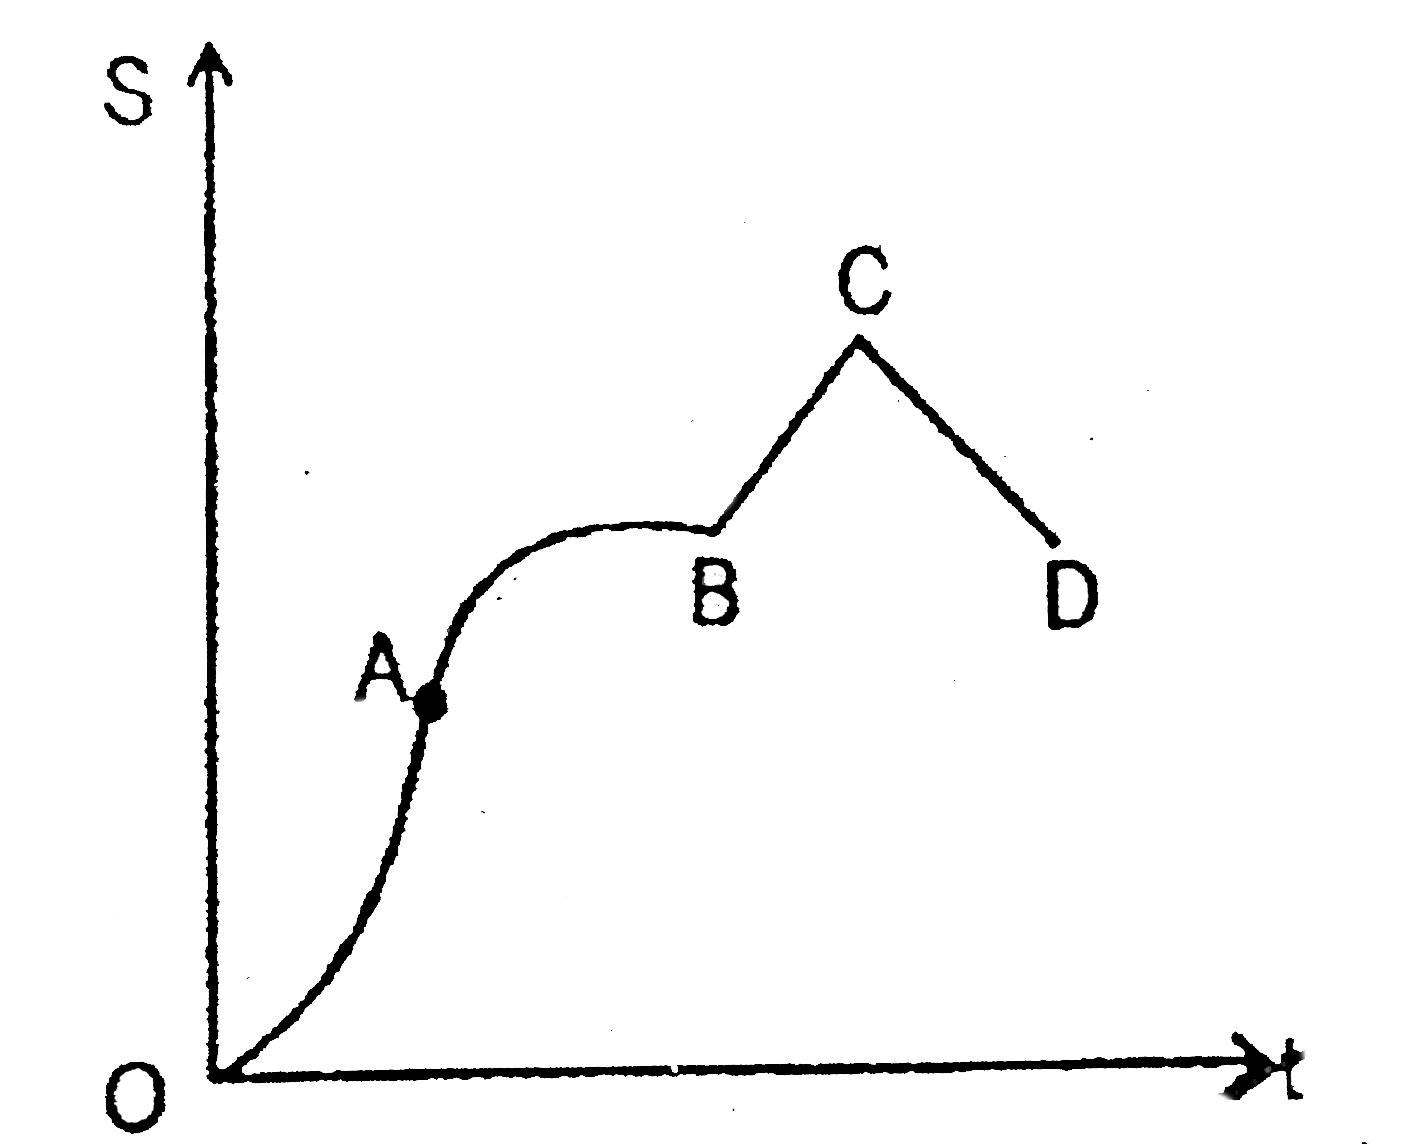
The graph between the displacement x and time t for a particle moving in a straigh lin ais shown in figure. During the internal OA,AB,BC and CD, the acceleration of the particle is:
OAABBCCD+0++
OAABBCCD−0+0
OAABBCCD+0−+
OAABBCCD−0−0
The correct Answer is:B
Step by step video solution for The graph between the displacement x and time t for a particle moving in a straigh lin ais shown in figure. During the internal OA,AB,BC and CD, the acceleration of the particle is: by Physics experts to help you in doubts & scoring excellent marks in Class 11 exams.
Updated on:21/07/2023Similar Questions
The graph between the displacement x and time t for a particle moving in a straight line is shown in the figure. During the interval OA,AB,BC and CD the acceleration of the particle is
OA,AB,BC,CD
View SolutionDisplacement time graph of a particle moving in a straight line is a shown in figure.

View SolutionVelocity displacement graph of a particle moving in a straight line is as shown in figure.

View SolutionThe graph between displacement and time for a particle moving with uniform acceleration is a
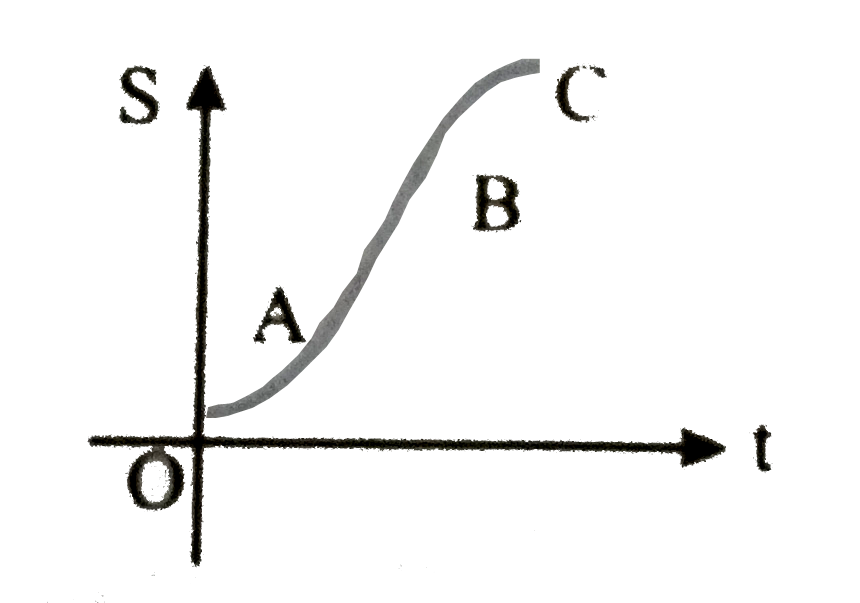
View SolutionDisplacement time graph of a particle moving in a straight line is as shown in figure. Select the correct alternative (s) :
 .
.
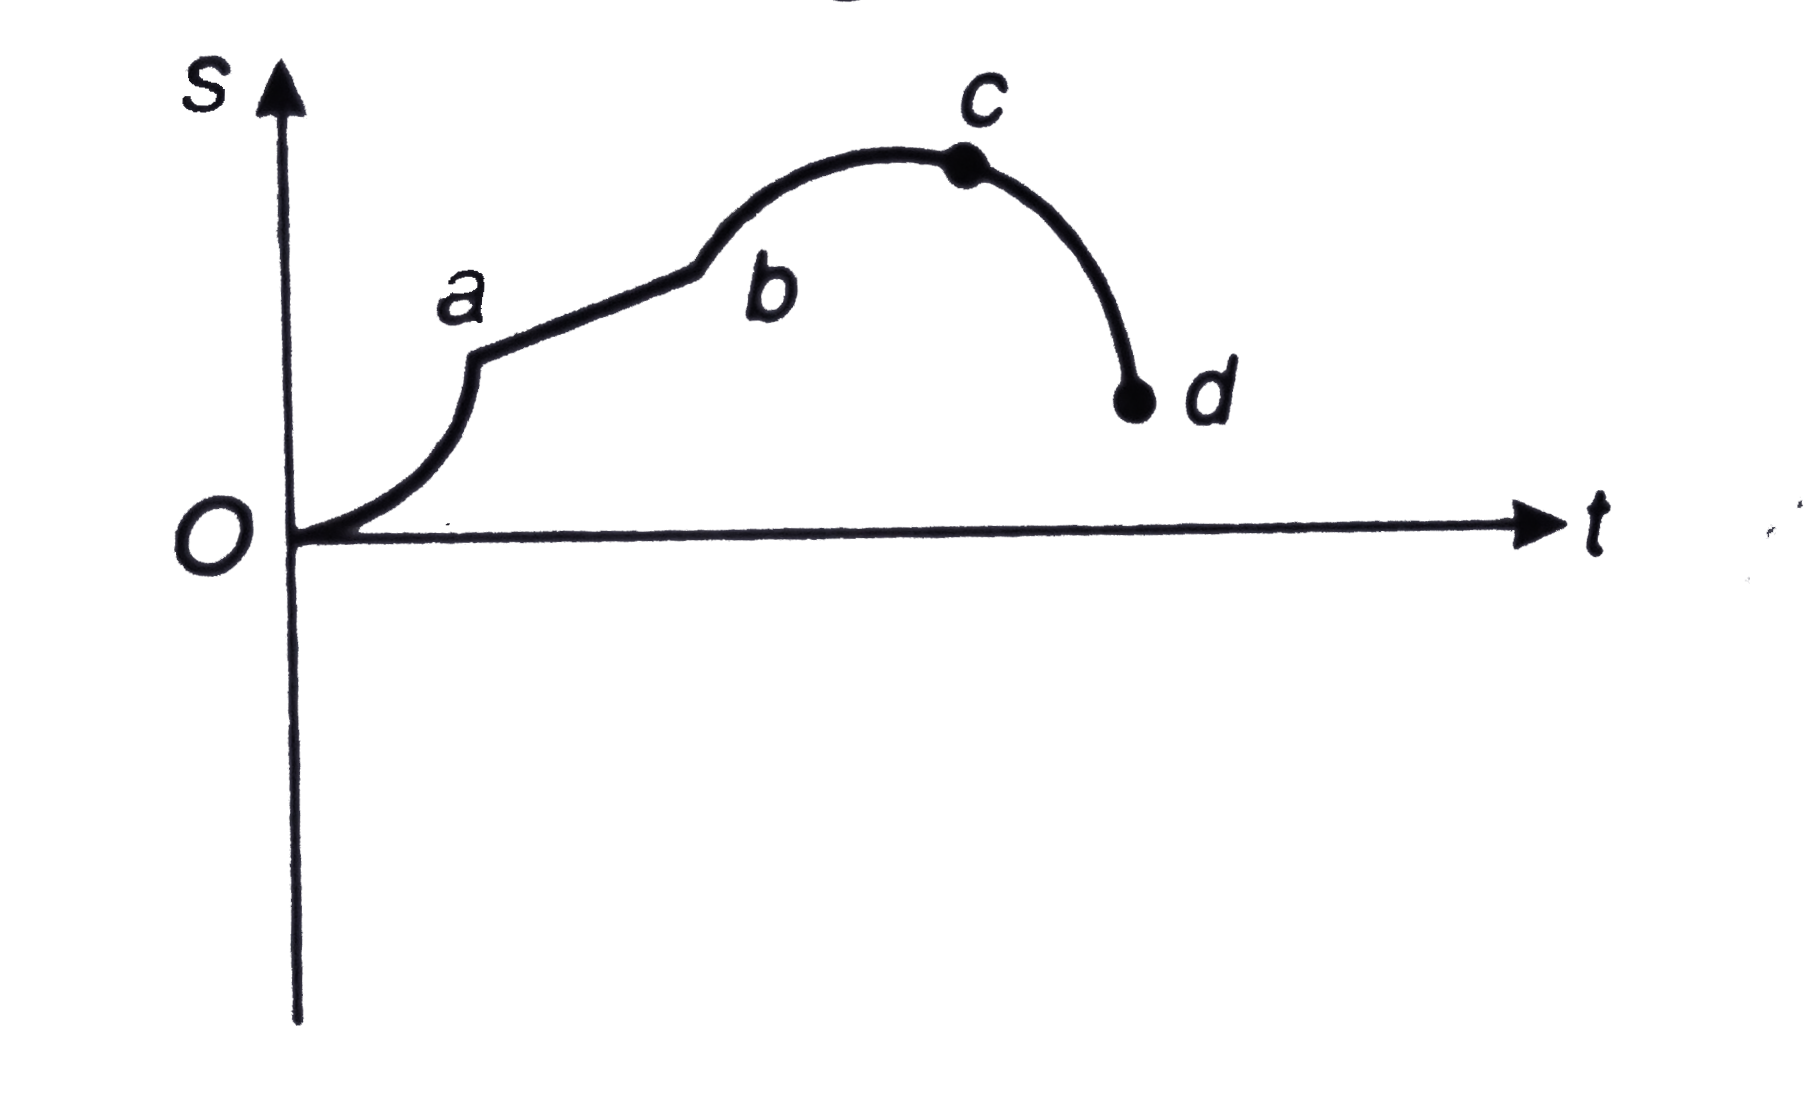
View SolutionDisplacement-time graph of a particle moving in a straight line is as shown in figure.
Find the sign of velocity and acceleration in regions oa,ab, bc and cd.
View SolutionVelocity versus displacement graph of a particle moving in a straight line as shown in figure.
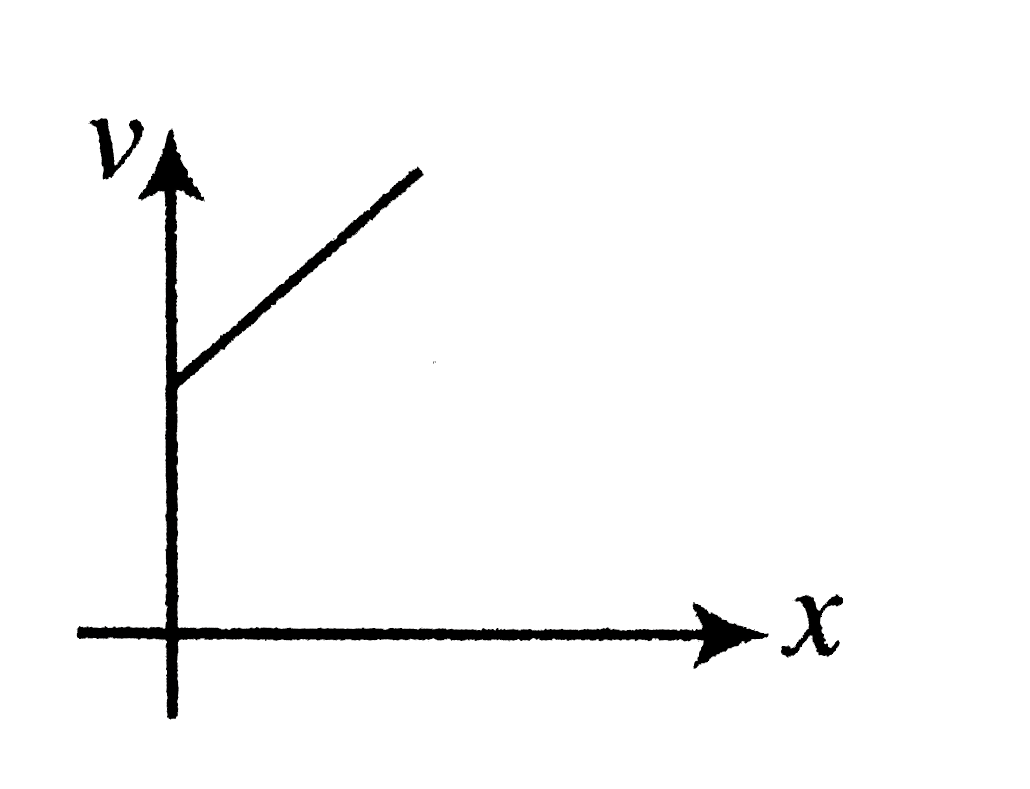
The acceleration of the particle.
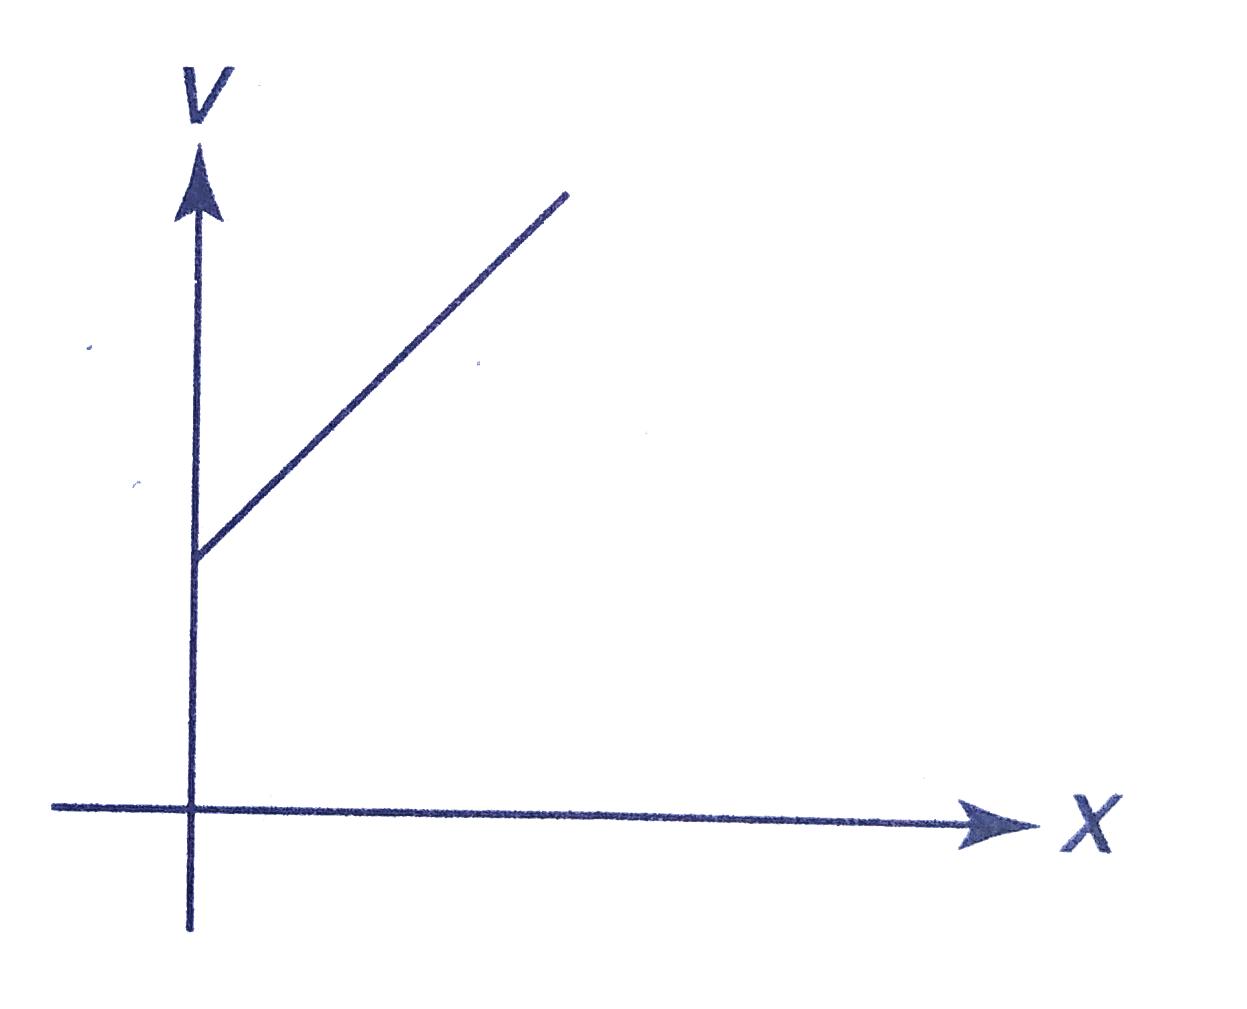
View SolutionGraph of velocity versus displacement of a particle moving in a straight line is as shown in figure.
The acceleration of the particle is.
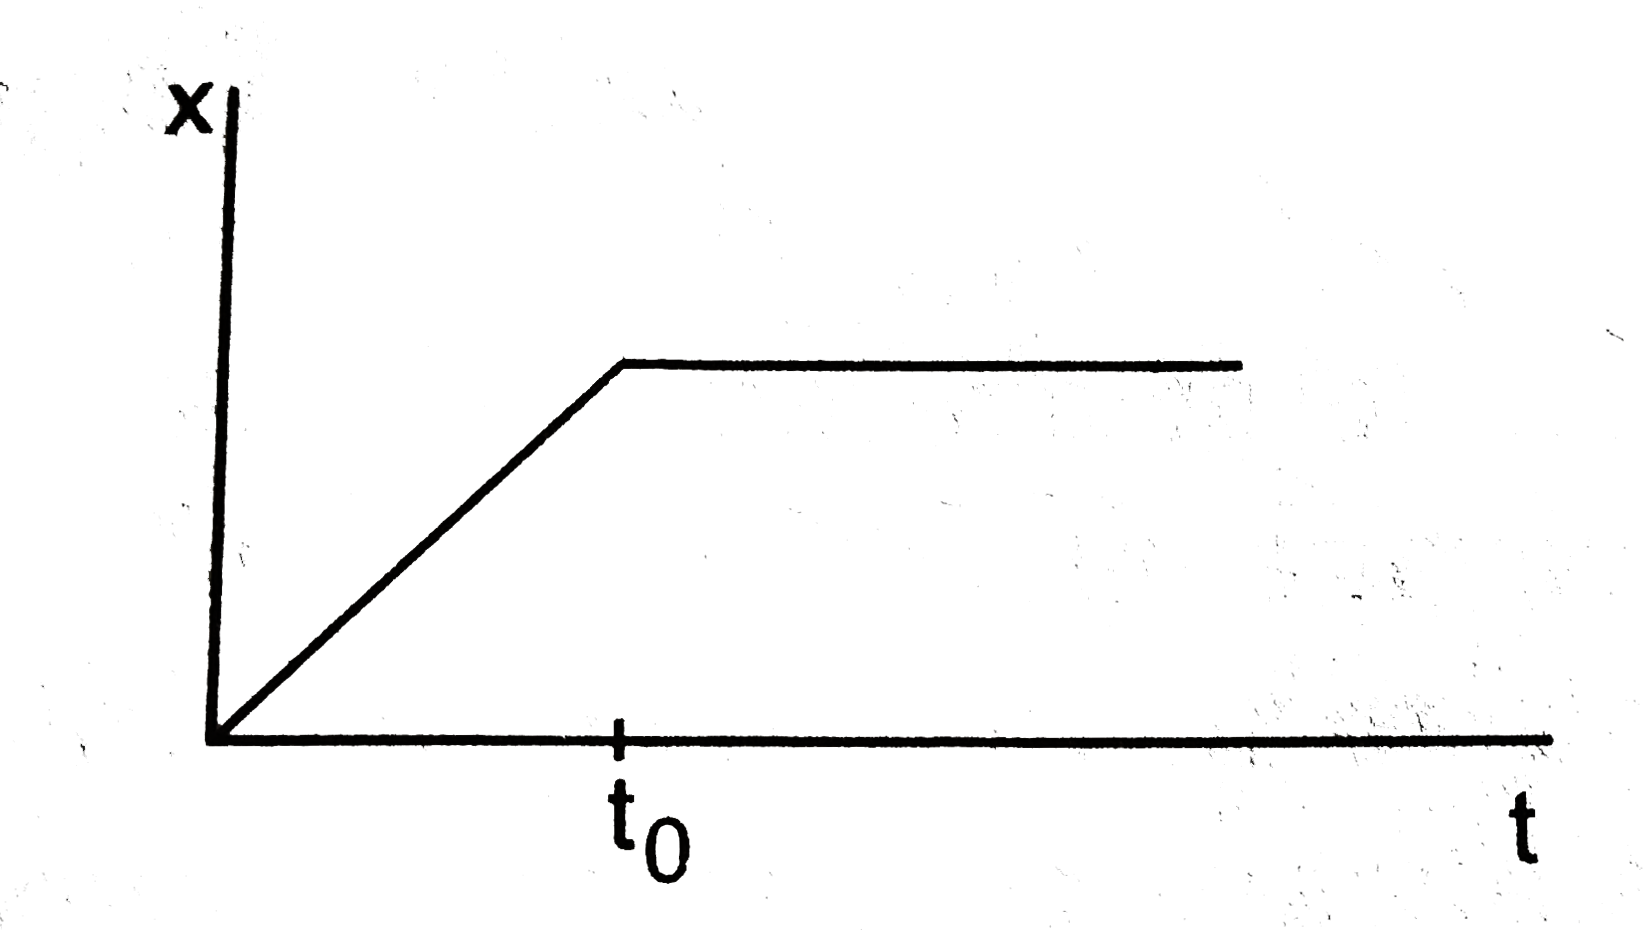
View SolutionFigure shows the displacement time graph of a particle moving on the X-axis
View SolutionDisplacment-time graph of a particle moving in a straight line is as shown in figure. Choose the INCORRECT statement(s)
View Solution
