Assuming the earth to be a uniform sphere of mass M and radium R. which of the following graphs represents the variation of acceleration due to gravity with distance .r. from the centre of the earth.
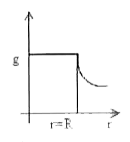
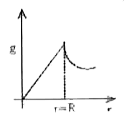
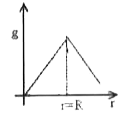
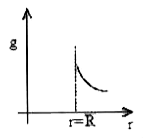
The correct Answer is:B
To solve the problem of how the acceleration due to gravity (g) varies with distance (r) from the center of the Earth, we can break it down into two distinct regions: outside the Earth and inside the Earth.
1. Understanding the Problem:
- We need to analyze how the acceleration due to gravity changes as we move from the center of the Earth to a point outside its surface.
2. Acceleration Outside the Earth (r > R):
- When we are outside the Earth (at a distance r from the center where r > R), we can treat the Earth as a point mass located at its center.
- The formula for gravitational acceleration at a distance r from the center of a mass M is given by:
g=GMr2
- Here, G is the gravitational constant, M is the mass of the Earth, and r is the distance from the center of the Earth.
- As r increases, g decreases with the square of the distance (inversely proportional to r2).
3. Acceleration At the Surface of the Earth (r = R):
- At the surface of the Earth (r = R), the acceleration due to gravity is:
g=GMR2
4. Acceleration Inside the Earth (r < R):
- When we are inside the Earth (at a distance r from the center where r < R), we can use the concept of a uniform spherical shell.
- According to the shell theorem, the gravitational force inside a uniform spherical shell is zero. Therefore, only the mass that is at a radius less than r contributes to the gravitational acceleration.
- The effective mass m′ that contributes to gravity at distance r is:
m′=43πr3ρ
- Here, ρ is the density of the Earth.
- The acceleration due to gravity inside the Earth is given by:
g′=Gm′r2=G(43πr3ρ)r2=43πGρr
- This shows that g′ is directly proportional to r when r < R.
5. Graphical Representation:
- From the analysis:
- For r < R, g increases linearly with r.
- For r = R, g reaches its maximum value.
- For r > R, g decreases as 1r2.
- Therefore, the graph of g vs. r will show a linear increase from the center to the surface, and then a decrease as we move away from the surface.
6. Conclusion:
- The correct graph representing the variation of acceleration due to gravity with distance from the center of the Earth is option 2, which shows a linear increase up to R and then a decrease inversely proportional to r2 beyond R.
- We need to analyze how the acceleration due to gravity changes as we move from the center of the Earth to a point outside its surface.
- When we are outside the Earth (at a distance r from the center where r > R), we can treat the Earth as a point mass located at its center.
- The formula for gravitational acceleration at a distance r from the center of a mass M is given by:
g=GMr2
- Here, G is the gravitational constant, M is the mass of the Earth, and r is the distance from the center of the Earth.
- As r increases, g decreases with the square of the distance (inversely proportional to r2).
- At the surface of the Earth (r = R), the acceleration due to gravity is:
g=GMR2
- When we are inside the Earth (at a distance r from the center where r < R), we can use the concept of a uniform spherical shell.
- According to the shell theorem, the gravitational force inside a uniform spherical shell is zero. Therefore, only the mass that is at a radius less than r contributes to the gravitational acceleration.
- The effective mass m′ that contributes to gravity at distance r is:
m′=43πr3ρ
- Here, ρ is the density of the Earth.
- The acceleration due to gravity inside the Earth is given by:
g′=Gm′r2=G(43πr3ρ)r2=43πGρr
- This shows that g′ is directly proportional to r when r < R.
- From the analysis:
- For r < R, g increases linearly with r.
- For r = R, g reaches its maximum value.
- For r > R, g decreases as 1r2.
- Therefore, the graph of g vs. r will show a linear increase from the center to the surface, and then a decrease as we move away from the surface.
- The correct graph representing the variation of acceleration due to gravity with distance from the center of the Earth is option 2, which shows a linear increase up to R and then a decrease inversely proportional to r2 beyond R.
Similar Questions
Which graph correctley presents the variation of acceleration due to gravity with the distance form the centre of the earth?
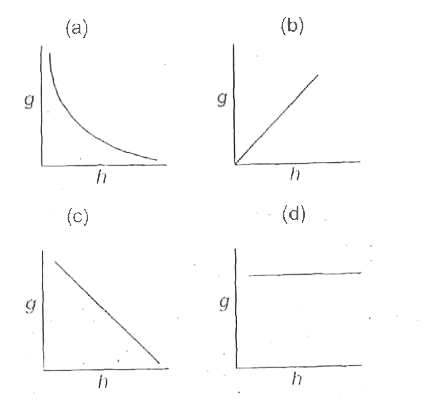
View SolutionWhich of the following graphs shows the variation of acceleration due to gravity g with depth h from the surface of the earth ?
View SolutionWhich one of the following graphs represents the variation of electric field with distance r from the centre of a charged spherical conductor of radius R?
View SolutionWhich of the following graphs correctly represents the variation of g on the - Earth?
View SolutionThe acceleration due to gravity at a depth R/2 below the surface of the earth is
View SolutionThe diagram showing the variation of gravitational potential of earth with distance from the centre of earth is
View SolutionStarting from the centre of the earth having radius R, the variation of g (acceleration due to gravity) is shown by
View SolutionIf earth is assumed to be a sphere of uniform density then plot a graph between acceleration due to gravity (g) and distance from the centre of earth.
View SolutionAssuming the earth to be a homogeneous sphere of radius R, its density in terms of G (constant of gravitation) and g (acceleration due to gravity on the surface of the earth)
View SolutionA satellite of mass m is moving in a circular or orbit of radius R around the earth. The radius of the earth is r and the acceleration due to gravity at the surface of the earth is g. Obtain expressions for the following :
(a) The acceleration due to gravity at a distance R from the centre of the earth
(b) The linear speed of the satellite
(c ) The time period of the satellite
View Solution

