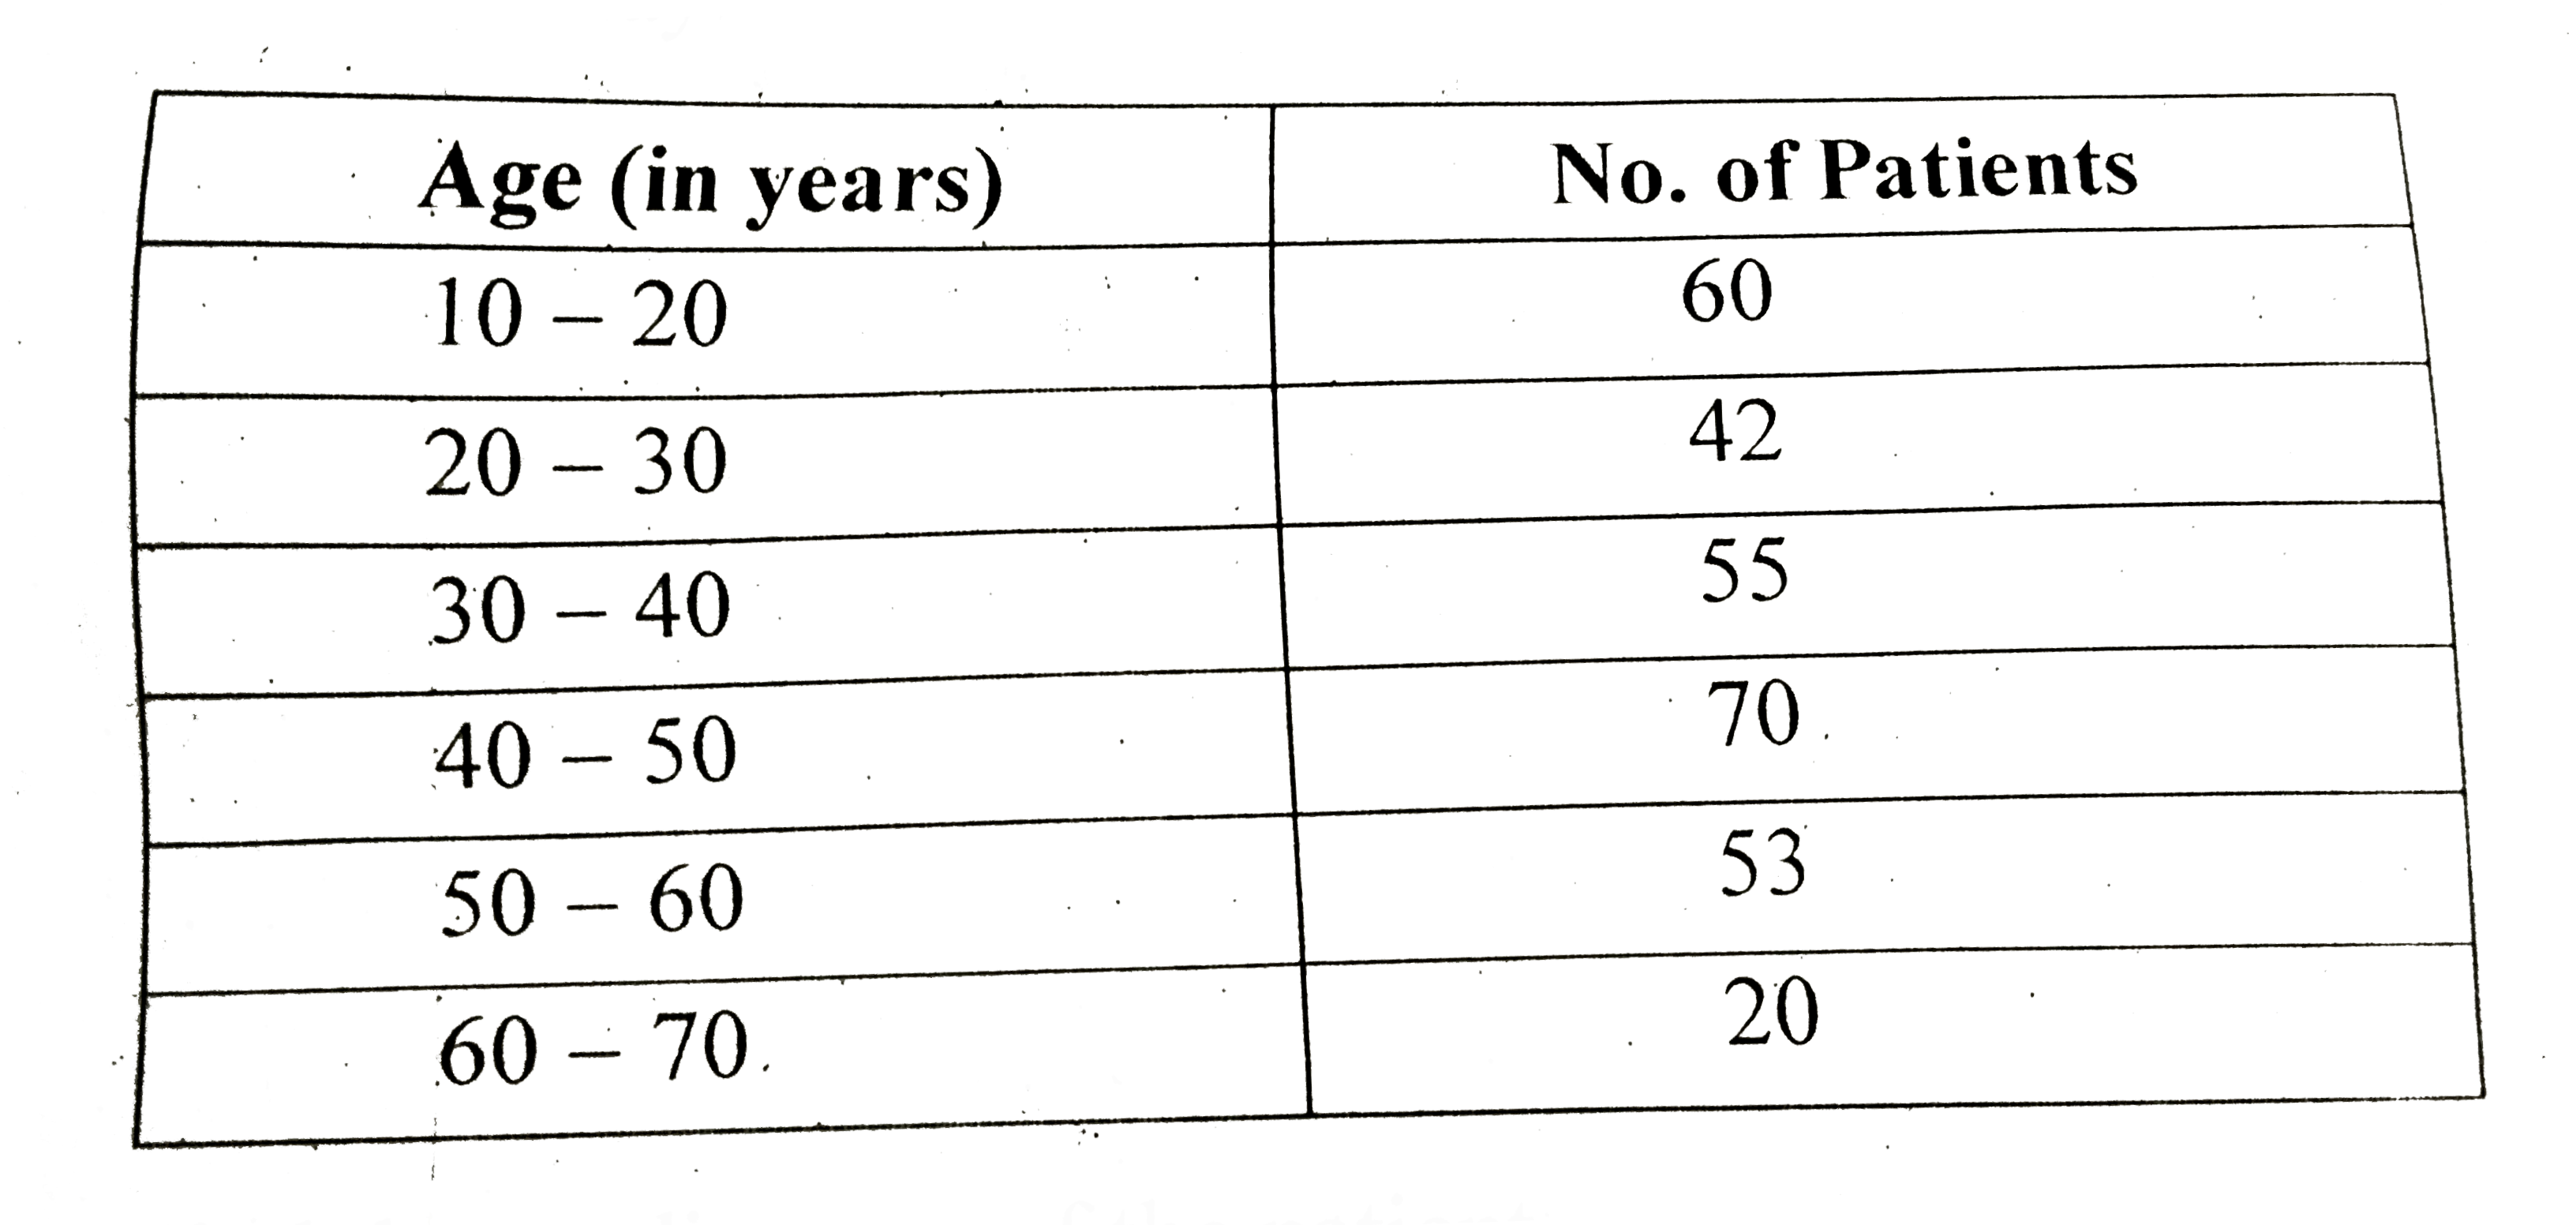
The following table shows the ages of the patients admitted in a hospital during a year: Find the mode and the mean of the data given above. Compare and interpret the two measures of central tendency.
The correct Answer is:36.8 years.
Step by step video, text & image solution for The following table shows the ages of the patients admitted in a hospital during a year: Find the mode and the mean of the data given above. Compare and interpret the two measures of central tendency. by Maths experts to help you in doubts & scoring excellent marks in Class 10 exams.
Updated on:21/07/2023Topper's Solved these Questions
- STATISTICSBOOK - OSWAL PUBLICATIONCHAPTER - STATISTICSEXERCISE - NCERT CORNER (Exercise - 14.3)
7 Videos
- STATISTICSBOOK - OSWAL PUBLICATIONCHAPTER - STATISTICSEXERCISE - NCERT CORNER (Exercise - 14.4)
3 Videos
- STATISTICSBOOK - OSWAL PUBLICATIONCHAPTER - STATISTICSEXERCISE - NCERT CORNER (Exercise - 14.1)
9 Videos
- SOME APPLICATIONS OF TRIGONOMETRY (HEIGHTS AND DISTANCES) BOOK - OSWAL PUBLICATIONCHAPTER - SOME APPLICATIONS OF TRIGONOMETRY (HEIGHTS AND DISTANCES) EXERCISE - CASE-BASED MCQs
15 Videos
- SURFACE AREAS AND VOLUMES BOOK - OSWAL PUBLICATIONCHAPTER - SURFACE AREAS AND VOLUMES EXERCISE - BOARD CORNER (LONG ANSWER TYPE QUESTIONS)
9 Videos
Similar Questions
The following frequency dsitribution table gives the ages of 80 patients treated in a hospital during a month. Find the mode of the ages of the patients.

View SolutionThe following frequency distribution table gives the ages of 200 patients treated in a hospital in a weak. Find the mode of ages of the patients.

View SolutionThe following table shows ages of 300 patients getting medical treatment in a hospital on a particular day:

Find the median age of the patient.
View SolutionThe following frequency distribution table gives the ages of 200 patients treated in a hospital in a week. Find the mode of ages of the patients.

View SolutionThe following frequency distribution table given the ages of 200 patients treated in a hospital in a week.Find the mode of ages of the pateints.

View SolutionFind the mean of the data given in the following table :

View SolutionThe following table shows ages of people who went to a particular play of circus in a day.

Find the mode of the ages of the vistiors.
View SolutionThe following table shows the number of patients of differents age groups admitted to a hospital for treatement on a day. Find the median age of the patients.

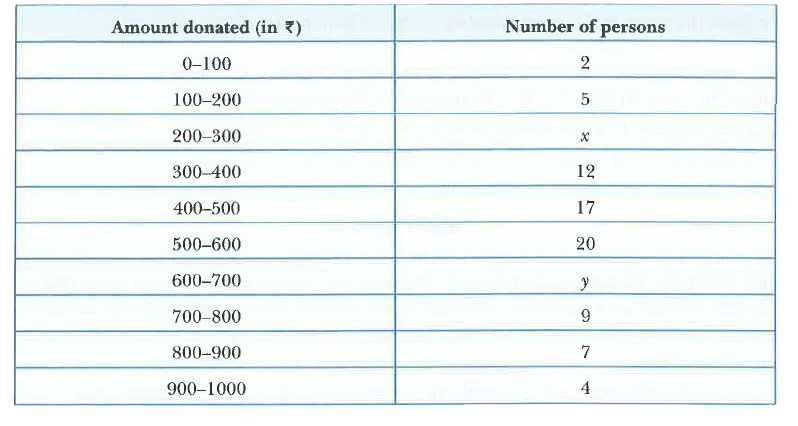
View SolutionThe following table shows the data of the amount donated by 100 people in a blind school.

If the median of the above data is 525, find the value of x and y.
What values are depicted here ?
View SolutionThe following table shows the marks obtained by 100 students of Class X in a school during a particular academic session. Find the mode of this distribution.
View Solution
