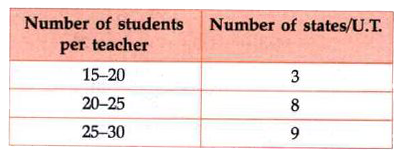
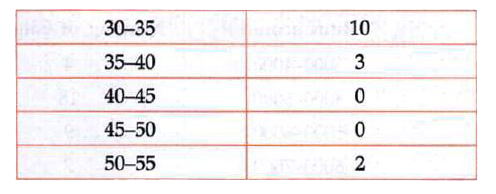
The following distribution gives the state-wise teacher-student ratio in higher secondary schools of India. Find the mode and mean of this data. Interprent the two measures.


The correct Answer is:29.215
Step by step video, text & image solution for The following distribution gives the state-wise teacher-student ratio in higher secondary schools of India. Find the mode and mean of this data. Interprent the two measures. by Maths experts to help you in doubts & scoring excellent marks in Class 10 exams.
Updated on:21/07/2023Topper's Solved these Questions
- STATISTICSBOOK - OSWAL PUBLICATIONCHAPTER - STATISTICSEXERCISE - NCERT CORNER (Exercise - 14.3)
7 Videos
- STATISTICSBOOK - OSWAL PUBLICATIONCHAPTER - STATISTICSEXERCISE - NCERT CORNER (Exercise - 14.4)
3 Videos
- STATISTICSBOOK - OSWAL PUBLICATIONCHAPTER - STATISTICSEXERCISE - NCERT CORNER (Exercise - 14.1)
9 Videos
- SOME APPLICATIONS OF TRIGONOMETRY (HEIGHTS AND DISTANCES) BOOK - OSWAL PUBLICATIONCHAPTER - SOME APPLICATIONS OF TRIGONOMETRY (HEIGHTS AND DISTANCES) EXERCISE - CASE-BASED MCQs
15 Videos
- SURFACE AREAS AND VOLUMES BOOK - OSWAL PUBLICATIONCHAPTER - SURFACE AREAS AND VOLUMES EXERCISE - BOARD CORNER (LONG ANSWER TYPE QUESTIONS)
9 Videos
Similar Questions
The following distribution gives the state-wise teacher-student ratio in higher secondary schools of India. Find the mode and mean of this data. Interpret the two measures.
View SolutionFind the mean, mode and median of the following data:

View SolutionThe following table shows the ages of the patients admitted in a hospital during a year:Find the mode and the mean of the data given above. Compare and interpret the two measures of central tendency.
View SolutionThe following frequency distribution table gives the ages of 200 patients treated in a hospital in a weak. Find the mode of ages of the patients.

View SolutionThe following frequency distribution table gives the ages of 200 patients treated in a hospital in a week. Find the mode of ages of the patients.

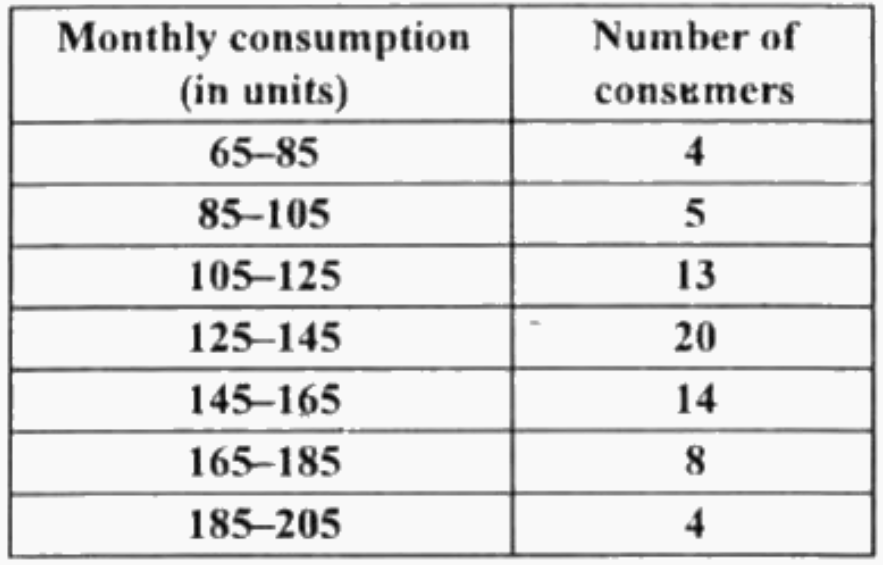
View SolutionThe following frequency distribution gives the monthly consumption of electricity of 68 consumers of a locality. Find the median, mean and mode of the data and compare them.

View SolutionFollowing data gives the marks obtained by 100 students in a test. Find the median

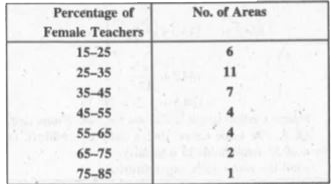
View SolutionThe table below gives the percentage distribution of female teachers in the schools of rural areas. Find the mean percentage of female teachers.

View SolutionFind the mean, median and mode of the following data.

View SolutionFind the mean, median and mode of the following data

View Solution
