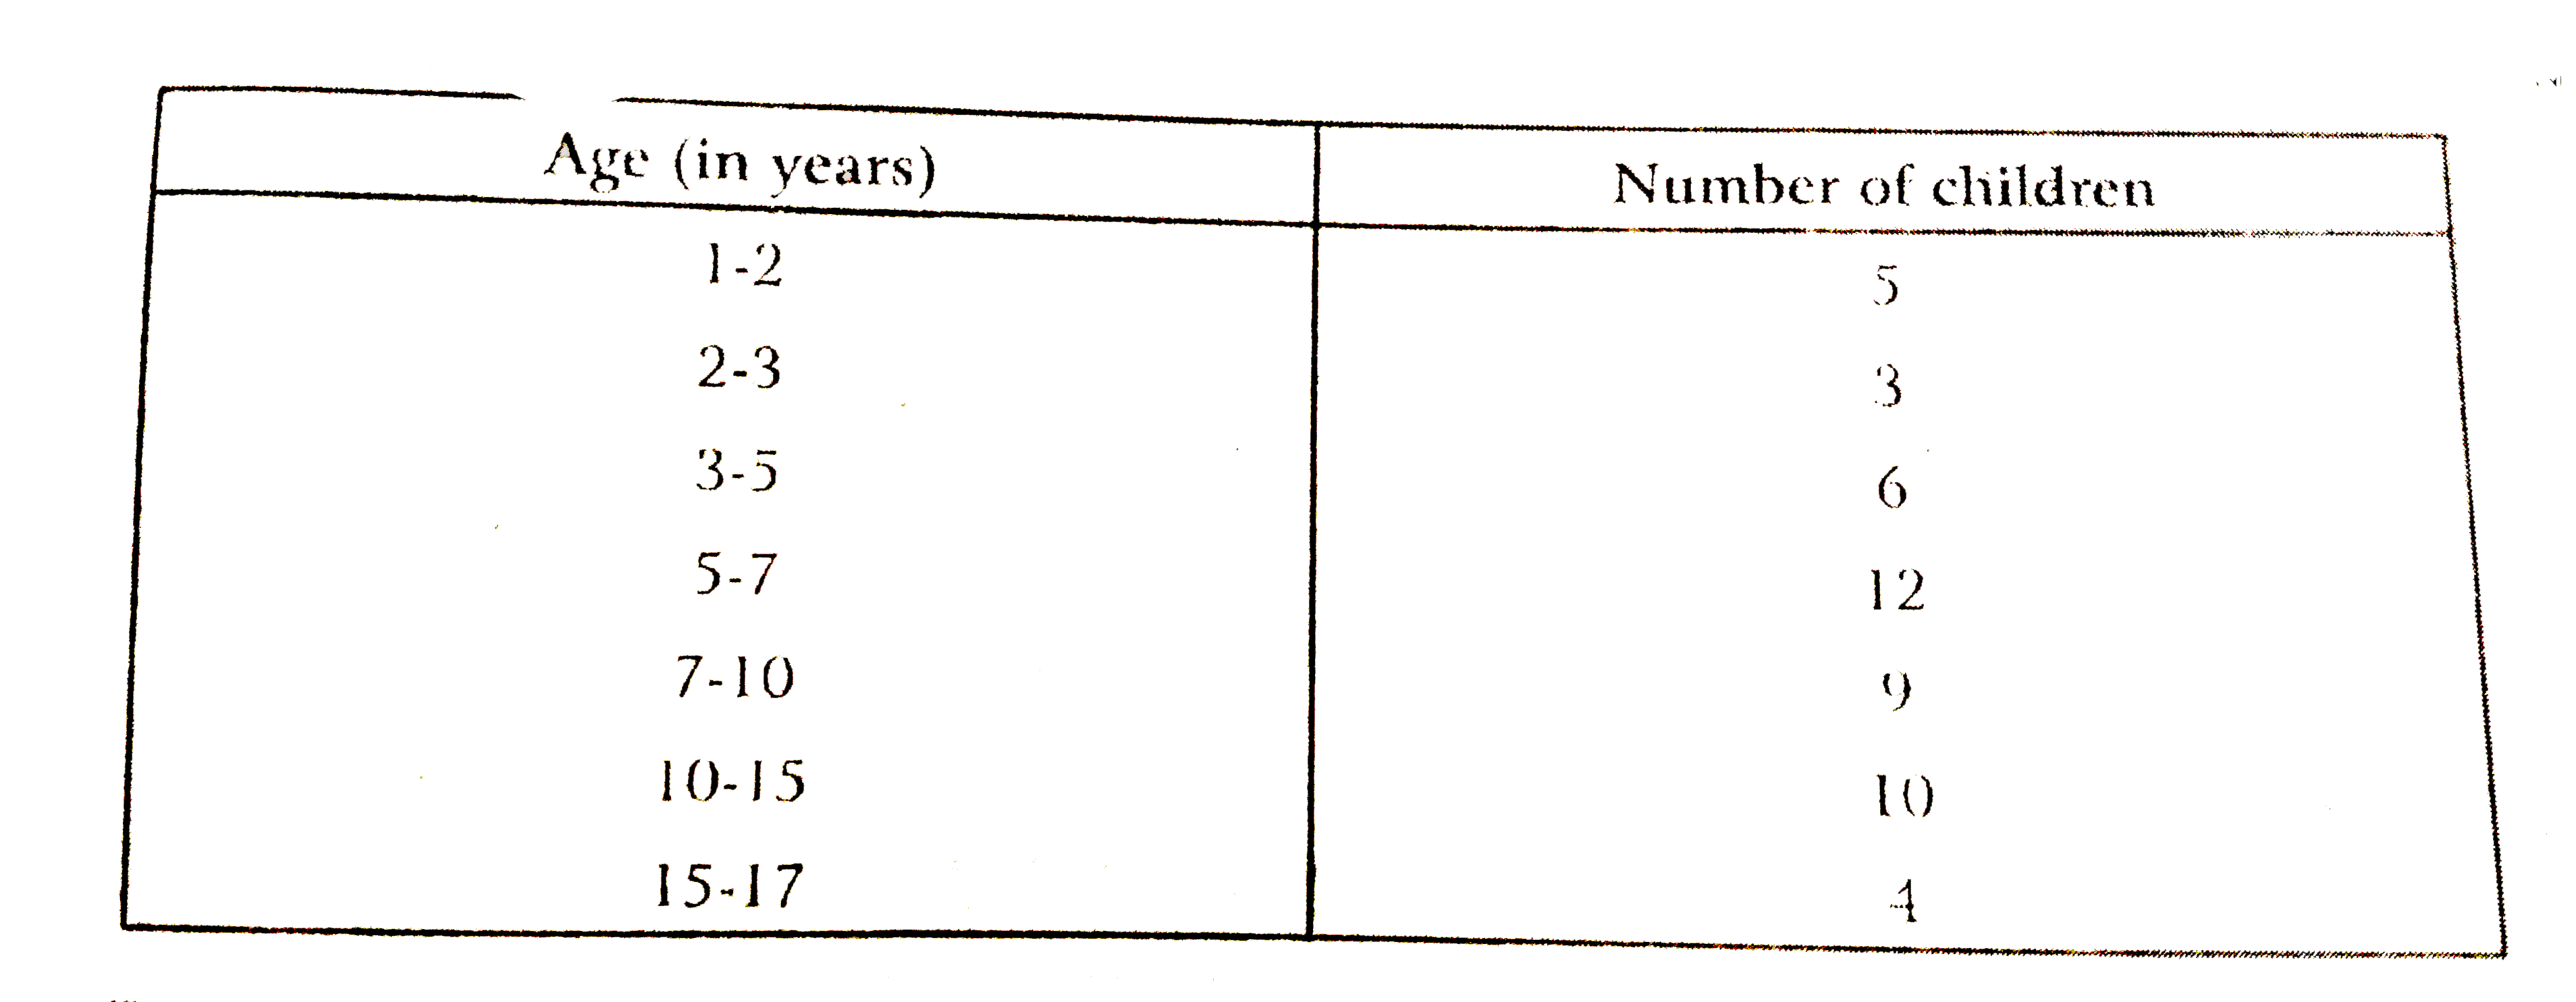
For which of these would you use a histogram to show the data?
The number of letters for different areas in a postman's bag
The height of competitors in an athletics meet
The number of cassettes produced by 5 companies
The number of passengers boarding trains from 7:00 am to 7:00 pm at a station
The correct Answer is:C
Step by step video, text & image solution for For which of these would you use a histogram to show the data? by Maths experts to help you in doubts & scoring excellent marks in Class 14 exams.
Updated on:21/07/2023Topper's Solved these Questions
- DATA HANDLINGBOOK - BHARDWAJ ACADEMYCHAPTER - DATA HANDLINGEXERCISE - CHAPTER EXERCISE (PREVIOUS YEARS QUESTIONS)
10 Videos
- DATA HANDLINGBOOK - BHARDWAJ ACADEMYCHAPTER - DATA HANDLINGEXERCISE - CHAPTER EXERCISE (PREVIOUS YEARS QUESTIONS)
10 Videos
- ALGEBRABOOK - BHARDWAJ ACADEMYCHAPTER - ALGEBRAEXERCISE - CHAPTER EXERCISE (Previous Years. Questions)
24 Videos
- ERROR ANALYSISBOOK - BHARDWAJ ACADEMYCHAPTER - ERROR ANALYSISEXERCISE - CHAPTER EXERCISE (Previous Year Questions)
19 Videos
Similar Questions
Knowledge Check
For which of the following would you use a histogram to show the data?
AThe number of letters for different areas in a postman's bagBThe height of competitors in an athletics meetCThe number of cassettes produced by 5 companiesDThe number of passengers boarding trains from 7:00 am to 7:00 pm at a stationWhich of these would you use to stain the cells red color ?
ASafranin solutionBMethylene blue solutionCGlycerine solutionDIodine solutionWhich of the following solutions would you use test the pH of a given sample?
ABlue litmus solutionBRed litmus solutionCUniversal indicator solutionDA mixture of blue and red litmus solutions
The height of a rectangle in a histogram shows
View SolutionDraw a histogram of the following data.

View SolutionA random survey of the number of children of various are groups playing in park was found as follows :

Draw a histogram to represent the data above.
View SolutionMake a frequency polygon and histogram using the given data :

View SolutionDraw a histogram for the following data:

View Solution


