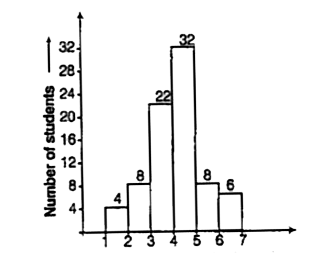
The number of hours for which students of a particular class watched telecvision during holidays is shown through the given graph.Answer the following.
How many students spent more than 5 hours in watching TV ?

14
12
10
16
The correct Answer is:A
Step by step video solution for The number of hours for which students of a particular class watched telecvision during holidays is shown through the given graph.Answer the following.How many students spent more than 5 hours in watching TV ? by Maths experts to help you in doubts & scoring excellent marks in Class 14 exams.
Updated on:21/07/2023Topper's Solved these Questions
- DATA HANDLINGBOOK - BHARDWAJ ACADEMYCHAPTER - DATA HANDLINGEXERCISE - CHAPTER EXERCISE
29 Videos
- DATA HANDLINGBOOK - BHARDWAJ ACADEMYCHAPTER - DATA HANDLINGEXERCISE - CHAPTER EXERCISE (PREVIOUS YEARS QUESTIONS)
10 Videos
- ALGEBRABOOK - BHARDWAJ ACADEMYCHAPTER - ALGEBRAEXERCISE - CHAPTER EXERCISE (Previous Years. Questions)
24 Videos
- ERROR ANALYSISBOOK - BHARDWAJ ACADEMYCHAPTER - ERROR ANALYSISEXERCISE - CHAPTER EXERCISE (Previous Year Questions)
19 Videos
Similar Questions
The number of hours for which students of a particular class watched television during holidays is shown through the given graph.Answer the following.(i) For how many hours did the maximum number of students watch TV?(ii) How many students watched TV for less than 4 hours?(iii) How many students spent more than 5 hours in watching TV?
View SolutionThe given pictograph represents the number of students in 5 sections of class VI.
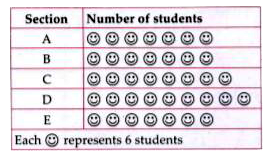
Study the given pictograph and answer the following questions.
How may students are there in section E ?
View Solution
Knowledge Check
Study the given histogram carefully and answer the questions given below it.
The number of hours for which students of a particular class watched television during holidays has been shown through the given graph.
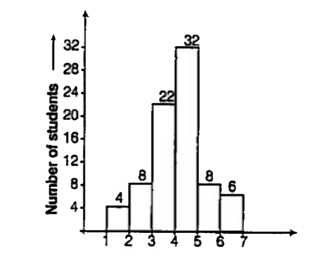
How many students spent more than 5h in watching TV?A14B12C10D16Study the given histoogram carefully and answer the questions given below.
The number of hours for which students of a particular class watched television during holidays has been shown through the given grahp.
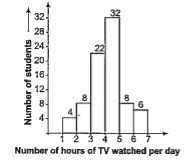
How many students spent more than 5 h in watching TV ?A14B12C10D16Study the given histogram carefully and answer the questions given below it.
The number of hours for which students of a particular class watched television during holidays has been shown through the given graph.
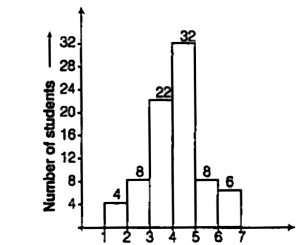
How many students watched TV for less than 4h?A30B28C22D34
The given pictograph represents the number of students in 5 sections of class VI.
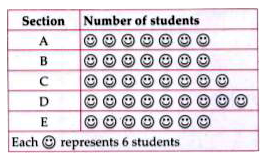
Study the given pictograph and answer the following questions.
How many less students are there in section E than section D ?
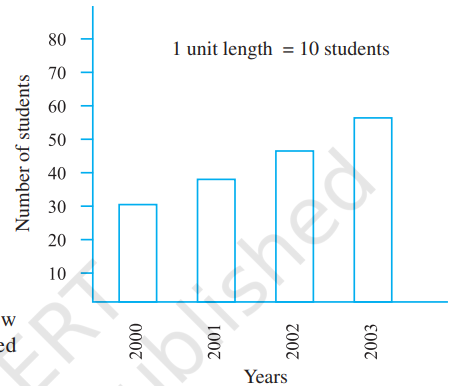
View SolutionRead the adjoining bar graph showing the number ofstudents in a particular class of a school. Answer thefollowing questions :(a) What is the scale of this graph?(b) How many new students are added every year?(c) Is the number of students in the year 2003 twice that in the year 2000?
View SolutionStudy the given histoogram carefully and answer the questions given below.
The number of hours for which students of a particular class watched television during holidays has been shown through the given grahp.
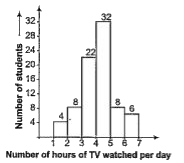
How many students watched TV for less then 4 h ?
View SolutionStudy the given histoogram carefully and answer the questions given below.
The number of hours for which students of a particular class watched television during holidays has been shown through the given grahp.
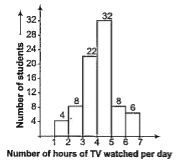
For how many hours did the maximum number of students watch TV ?
View SolutionStudy the given histogram carefully and answer the questions given below it.
The number of hours for which students of a particular class watched television during holidays has been shown through the given graph.
For how many hours did the maximum number of students watched TV?
View Solution
