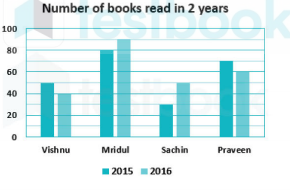
Directions: Read the bar graph carefully and answer the given questions.Total number of books read by Sachin and Mridul in both the years is how much more or less than the total
number of books read by Praveen and Vishnu in both the years?
30 More
30 Less
50 More
50 Less
Step by step video & image solution for Directions: Read the bar graph carefully and answer the given questions.Total number of books read by Sachin and Mridul in both the years is how much more or less than the total number of books read by Praveen and Vishnu in both the years? by Maths experts to help you in doubts & scoring excellent marks in Class 14 exams.
Updated on:21/07/2023Similar Questions
.
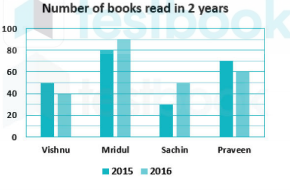
Directions: Read the bar graph carefully and answer the given questions.What is the sum of all the books read by all of them in both the years ?
View Solution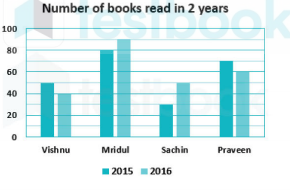
Directions: Read the bar graph carefully and answer the given questions.What is the average of total number of books read by all of them in the year 2016?
View Solution
Knowledge Check
Study the graph carefully and answer the following questions.
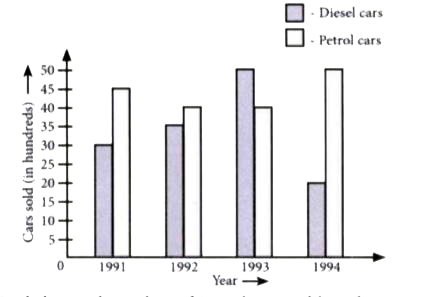
Find the total number of Diesel cars sold in the year 1992 and 1994 together.A2500B5500C1500D4500
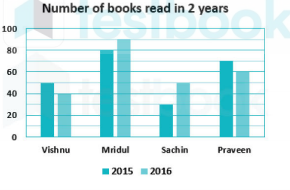
Directions: Read the bar graph carefully and answer the given questions.Books read by Praveen in the year 2015 is what percent more or less than the number of books read by Mridul in the year 2015 ?
View Solution.
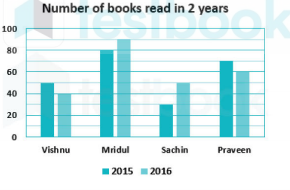
Directions: Read the bar graph carefully and answer the given questionsFind the ratio of sum of number of books read by Vishnu and Mridul together in 2015 to the sum of number of books read by Sachin and Praveen together in 2015.
View SolutionRead the bar graph carefully and answer the following questions.
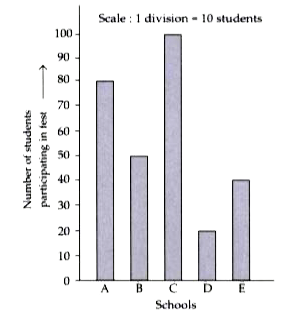 How may students of school B participated in the fest ?
View SolutionRead the bar graph carefully and answer the following questions.
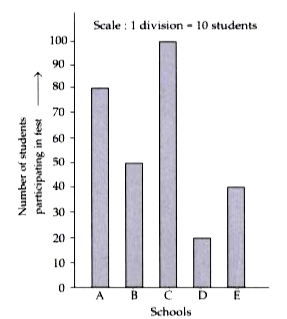 From which school maximum number of students participated ?
View SolutionRead the following graph carefully and answer the questions given below:
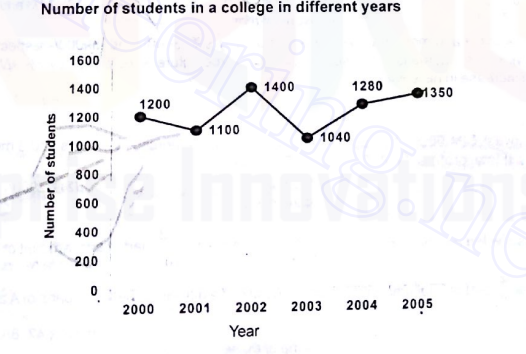
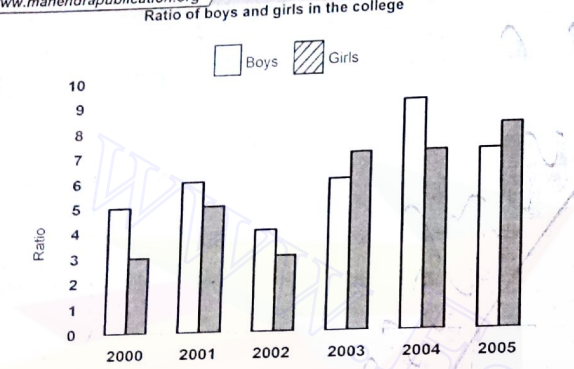
What is the average number of girls in all the years?
View SolutionRead the following bar graph given in figure and answer the following questions.
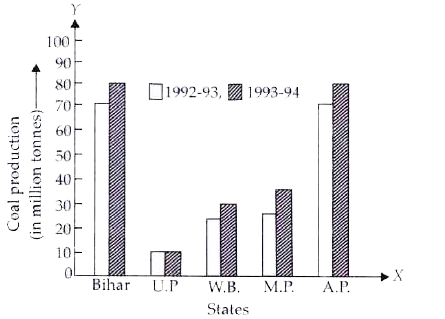
Name the state having same production in both the years?
View SolutionStudy the following bar graph and answer the question that follows.
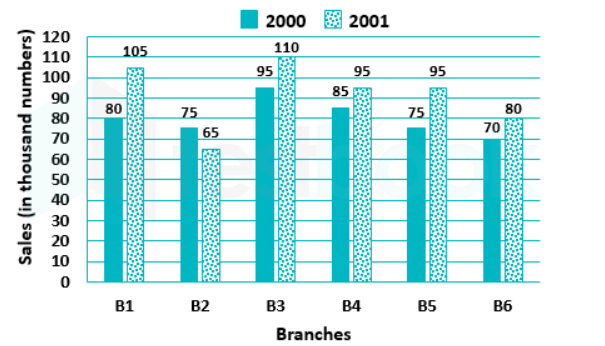
The total sales of books for branches Bl to B5 for the year 2000 is how much more than that of the average sales of books for branches Bl to B5 for the year 2001?
View Solution
