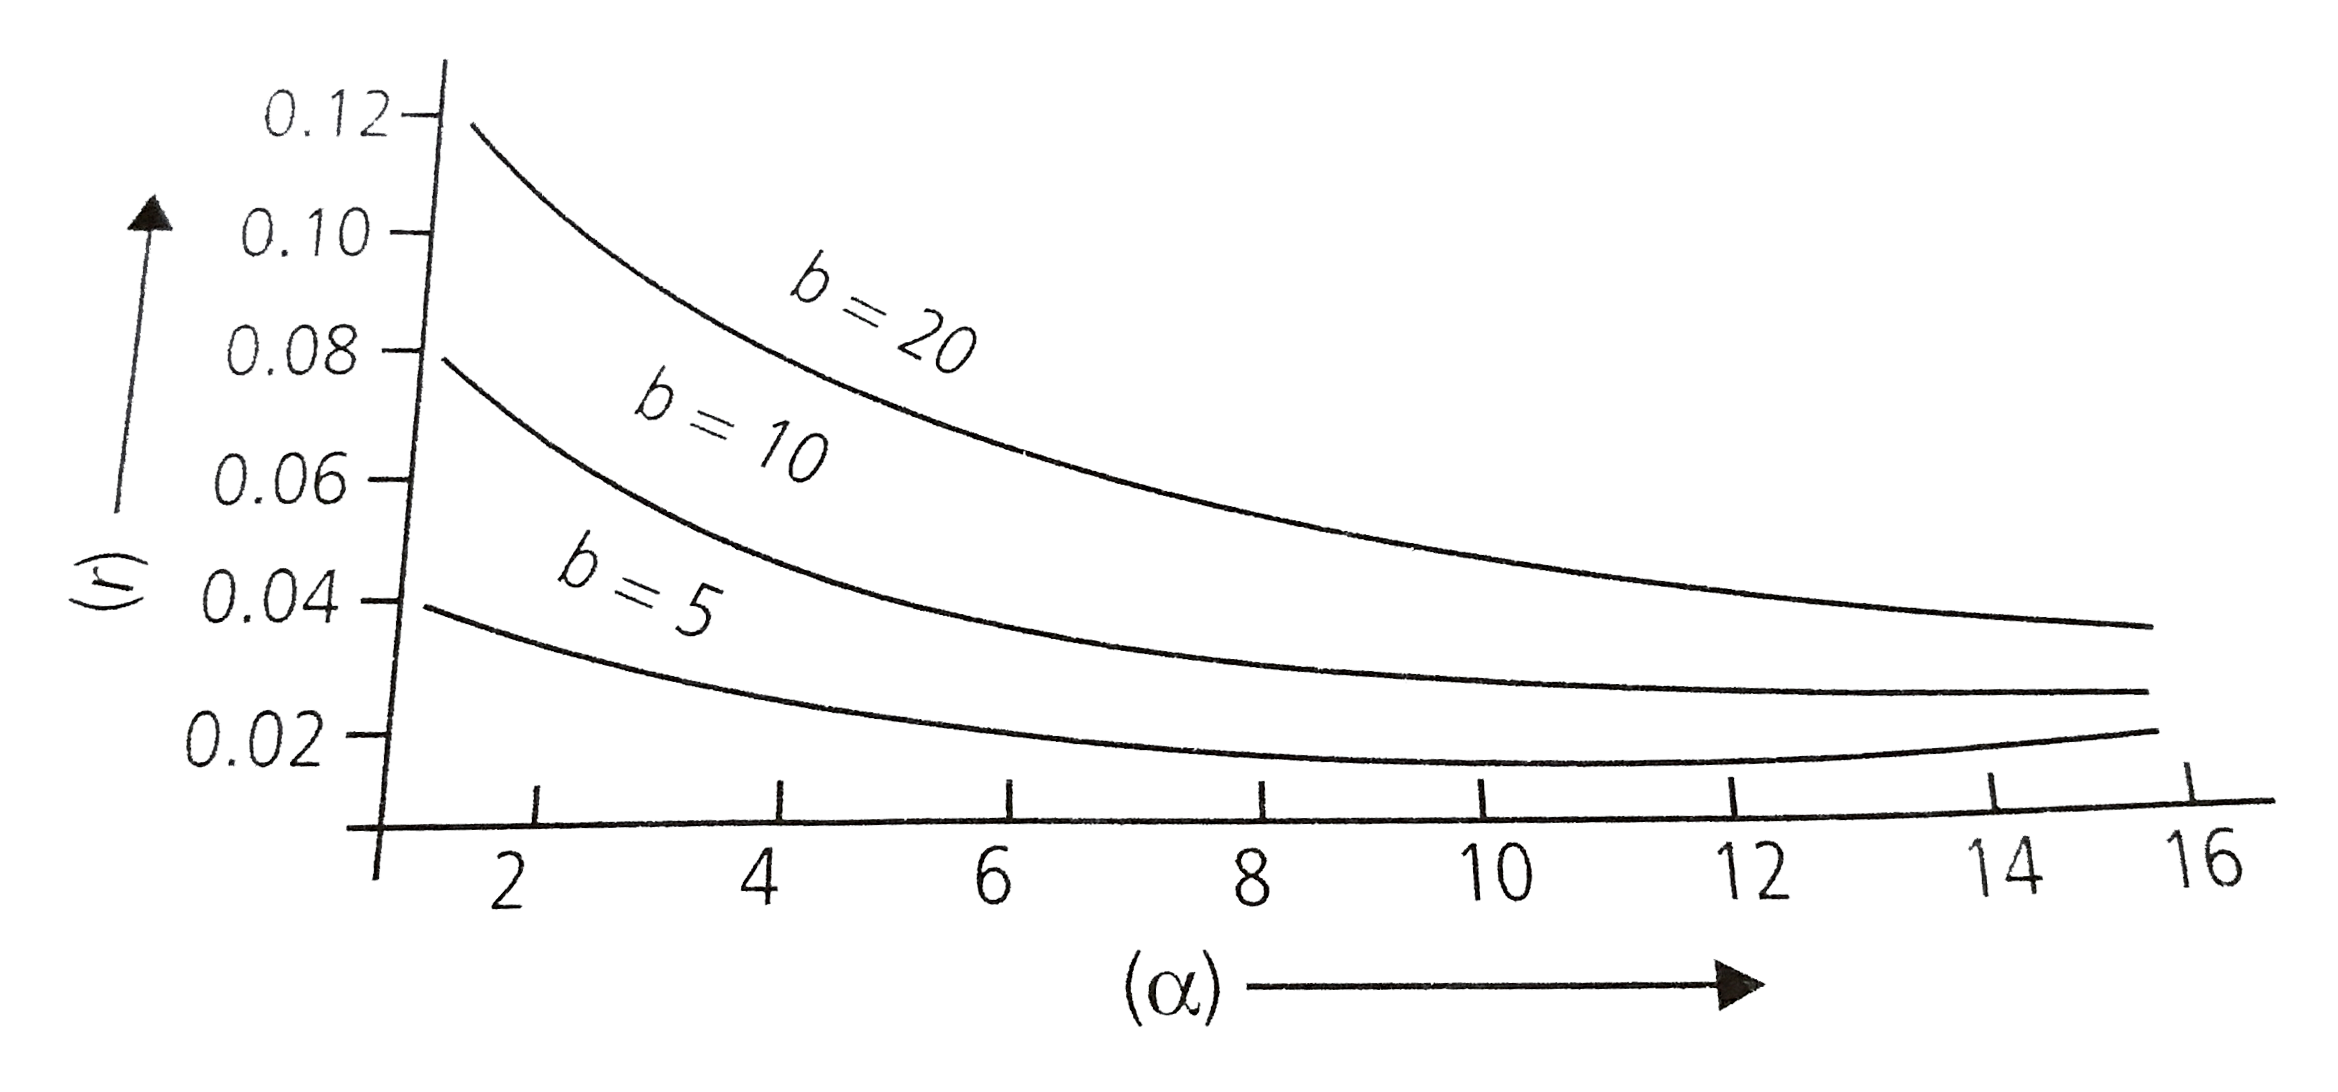
The graph below shows the relationships of per capita population growth rate (r), fecundity (b) and age at first reproduction (α) in an animal speies

What is the most important conclusion to be drawn from the graph ?Solution in Tamil
The population growth rate decreases as first reproduction in postponed to a later stage, regardless of fecundity
At any α, the higher the fecundity the higher is the population growth rate achieved
As the age at first reproduction is postponed further, the benefits of increasing fecundity on the population growth rate become progressively negligible
None of these
The correct Answer is:A
Fecundity is the reproductive output, usually of an individual or number of offspring produced or the capacity of reproduction . In the given curve, the population growth rate decreases as first reproduction is postponed to a later stage regardless of fecundity.
Similar Questions
The age pyramid for human population is shown below Which of the following conclusion can be drawn from the given age pyramid?
View SolutionThe graph in case of a population showing maximum intrinsic growth will be
View Solutionरिक्त स्थान की पूर्ति कीजिए -
समुद्र में लम्बी-लम्बी..............पायी जाती हैं।
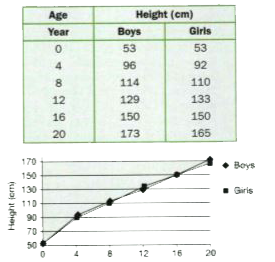
View SolutionThe table below shows the data on likely heights of boys and girls as they grow in age. Draw graphs of height and age for both boys and girls on the same graph paper. What conclusions can be drawn from these graphs?

View Solutionमानव में जनसंख्या वृद्धि का ग्राफ होता है
View SolutionFig. 2.18 A graph is drawn between displacement and time. What is the conclusion drawn from this graph?
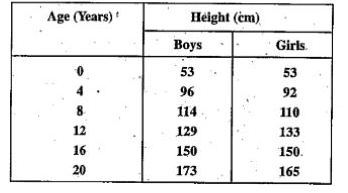
View SolutionThe table below shows the data on likely heights of boys and girls as they grow in age. Draw graphs showing height and age for both boys and girls on the same graph paper. What conclusions can be drawn from these graphs ?

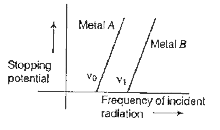
View SolutionWhat are the important conclusions from the graph shown below ?

View Solution
