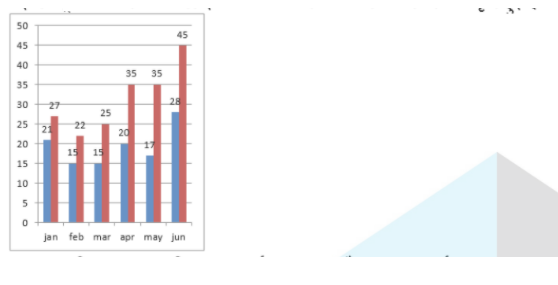
The data given shows the registration of bikes and total vehicles (in thousands) for six months in 2017 in city X.
Note: In the chart, the first number represents bikes and the second number represents
total vehicles.
The increase in registration of bikes from May to June 2017 is:
60%
70%
69%
64.70%
Step by step video & image solution for The data given shows the registration of bikes and total vehicles (in thousands) for six months in 2017 in city X. Note: In the chart, the first number represents bikes and the second number represents total vehicles. The increase in registration of bikes from May to June 2017 is: by Maths experts to help you in doubts & scoring excellent marks in Class 14 exams.
Updated on:21/07/2023Similar Questions
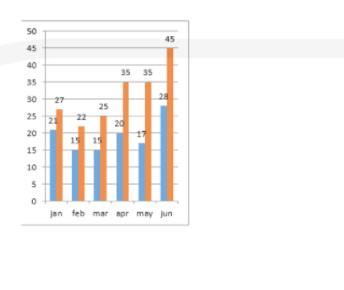
The given data shows the registration of bikes and total vehicles (in thousands) for 6 months in 2017 in City X. Note: In the chart, the first number represents bikes and the second number represents total vehicles. Based on the given data, from January to April 2017, the increase in the registration of vehicles other than bikes is ________ .
View Solution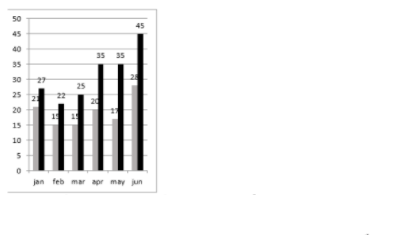
The given graph shows the registration of bikes and total vehicles (in thousands) for 6 months in 2017 in City X. Note: In the chart, the first number represents bikes (grey) and the second number represents total vehicles (black). Based on the given data, in March 2017, the number of vehicles other than bikes registered is:
View Solution
Knowledge Check
Given is a line graph showing the number of accidents in a city during the first 6 months of 1999.
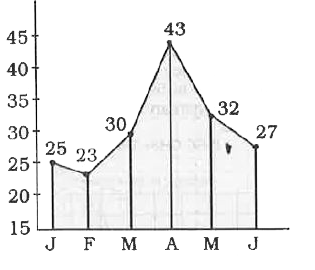
The decrease % of accidents from May to June isA1538%B1518%C1558%D1578%A vehicle registration numebr consists of 2 letters of English alphabet followed by 4 digits,where the first digit in not zero.Then the total number of vehicles with distinct registration number is
A262×104B26P2×10P4C26P2×13×6P6D262×9×103The table given below shows the number of customers (in thousand) visiting 2 shopping complexes A and B from january 2017 to June 2017.
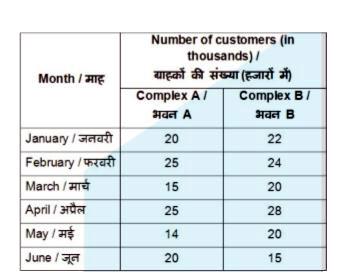
What is the total number of customers (in thousands) in the 2 complexes in the month of April?A52B53C50D56
The data given below shows the number motorcycles of the same brand sold by two dealers in the first six months of a year
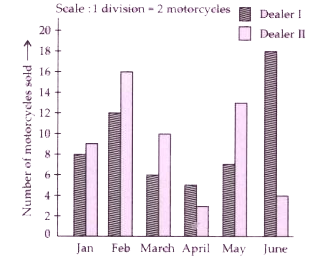
Find the total number of motorcycles sold by dealer II
View SolutionThe bar-chart is showing the number of accidents in a city during the first six month of a year. Examine the bar chart and answer the following questions.
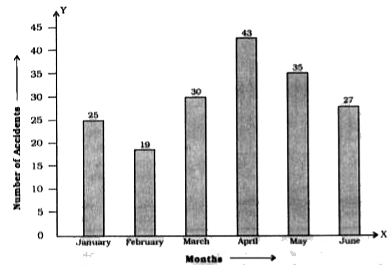
Percentage of decrease in t he number of accidents from May to June is :
View SolutionThe bar chart given below shows the number of audience in a multiscreen theatre for three shows .
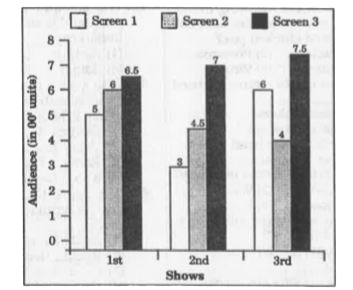
What is the percentage increase in the total number of audience second show to third show ?
View SolutionThe data given below shows the production of motor bikes in a factory for some months of two consecutive years.

Study the table given above and answer the following questions:
(a) Draw a double bar graph using appropriate scale to depict the above information and compare them.
(b) In which year was the total output the maximum?
(c) Find the mean production for the year 2007.
(d) For which month was the difference between the production for the two years the maximum?
(e) In which month for the year 2008, the production was the maximum?
(l) In which month for the year 2007, the production was the least?
View SolutionThe bar-chart is showing the number of accidents in a city during the first six month of a year. Examine the bar chart and answer the following questions.
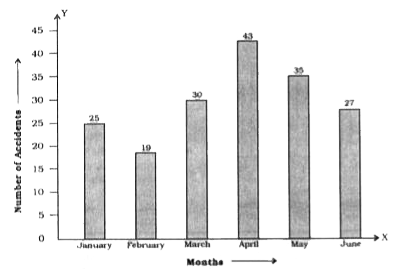
What is the percentage of accidents in the month of April to the total accidents in the city ?
View Solution
