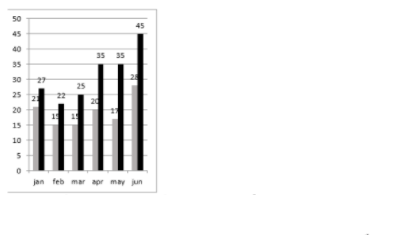
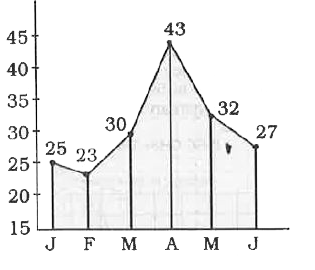
The given graph shows the registration of bikes and total vehicles (in thousands) for 6 months in 2017 in City X.
Note: In the chart, the first number represents bikes (grey) and the second number represents total vehicles (black).
Based on the given data, in March 2017, the number of vehicles other than bikes registered is:
9000
15000
11000
10000
Step by step video & image solution for The given graph shows the registration of bikes and total vehicles (in thousands) for 6 months in 2017 in City X. Note: In the chart, the first number represents bikes (grey) and the second number represents total vehicles (black). Based on the given data, in March 2017, the number of vehicles other than bikes registered is: by Maths experts to help you in doubts & scoring excellent marks in Class 14 exams.
Updated on:21/07/2023Similar Questions
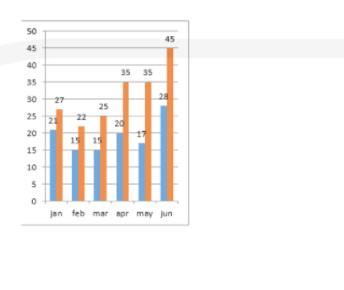
The given data shows the registration of bikes and total vehicles (in thousands) for 6 months in 2017 in City X. Note: In the chart, the first number represents bikes and the second number represents total vehicles. Based on the given data, from January to April 2017, the increase in the registration of vehicles other than bikes is ________ .
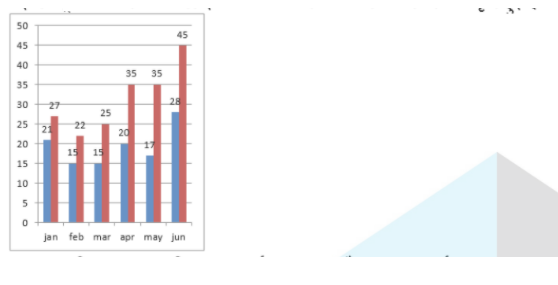
View SolutionThe data given shows the registration of bikes and total vehicles (in thousands) for six months in 2017 in city X. Note: In the chart, the first number represents bikes and the second number represents total vehicles. The increase in registration of bikes from May to June 2017 is:
View Solution
Knowledge Check
The following bar graph shows me sales (in thousands) of motor bikes by the factories, F1,F2, F3 and F4 in 2017, 2018 and 2019.
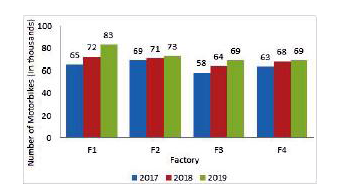
Which factory had the least number of sales across all the years?AF1BF3CF2DF4The given Bar Graph presents Different Type of Vehicles (in lakhs) exported by a company in 2016 and 2017.
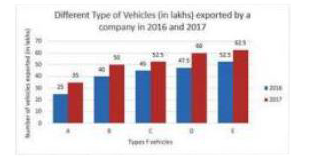
The total number of vehicles of type C and E exported by the company in 2017 is what percentage (correct to one decimal place) more than the total number of vehicles of type A, B and C exported in 2016?A5.4B4.5C4.1D5.2In given bar graph presents the number of different types of vehicles exported by a company during 2014?
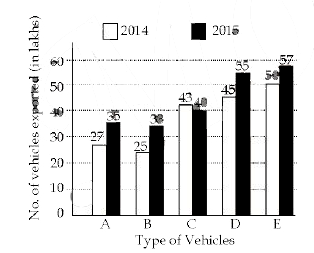
The total number of type B,D and E vehicles exported in 2014 is what percentage of the total number of type A,C,D and E vehicles exported in 2015A5.4B4.5C4.1D5.2
The data given below shows the number motorcycles of the same brand sold by two dealers in the first six months of a year
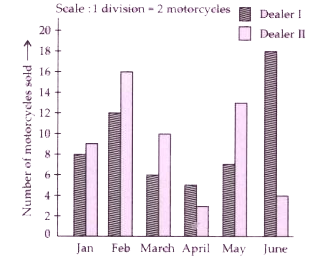
Find the total number of motorcycles sold by dealer II
View Solution
The average number of type A,B and D vehicles exported in 2015 was x% less than the number of type E vehicles exported in 2014 what is the value of x?
View SolutionThe following bar graph shows the number of vehicles passing through a road crossing in Delhi in different time intervals on a particular day. Read the bar graph and answer the following questions: What does the bar graph represent? Also, give the maximum number of vehicles. When is the hourly traffic maximum? Also give the minimum number of vehicles. When is the hourly traffic minimum? What is the total number of vehicles passing through a crossing during a particular day?
View SolutionThe table given below shows the number of customers (in thousand) visiting 2 shopping complexes A and B from january 2017 to June 2017.
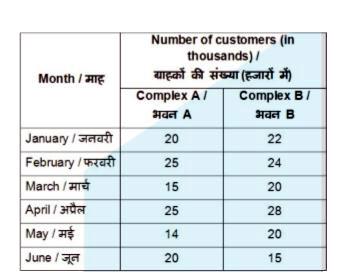
What is the total number of customers (in thousands) in the 2 complexes in the month of April?
View SolutionGiven is a line graph showing the number of accidents in a city during the first 6 months of 1999.
The decrease % of accidents from May to June is
View Solution
