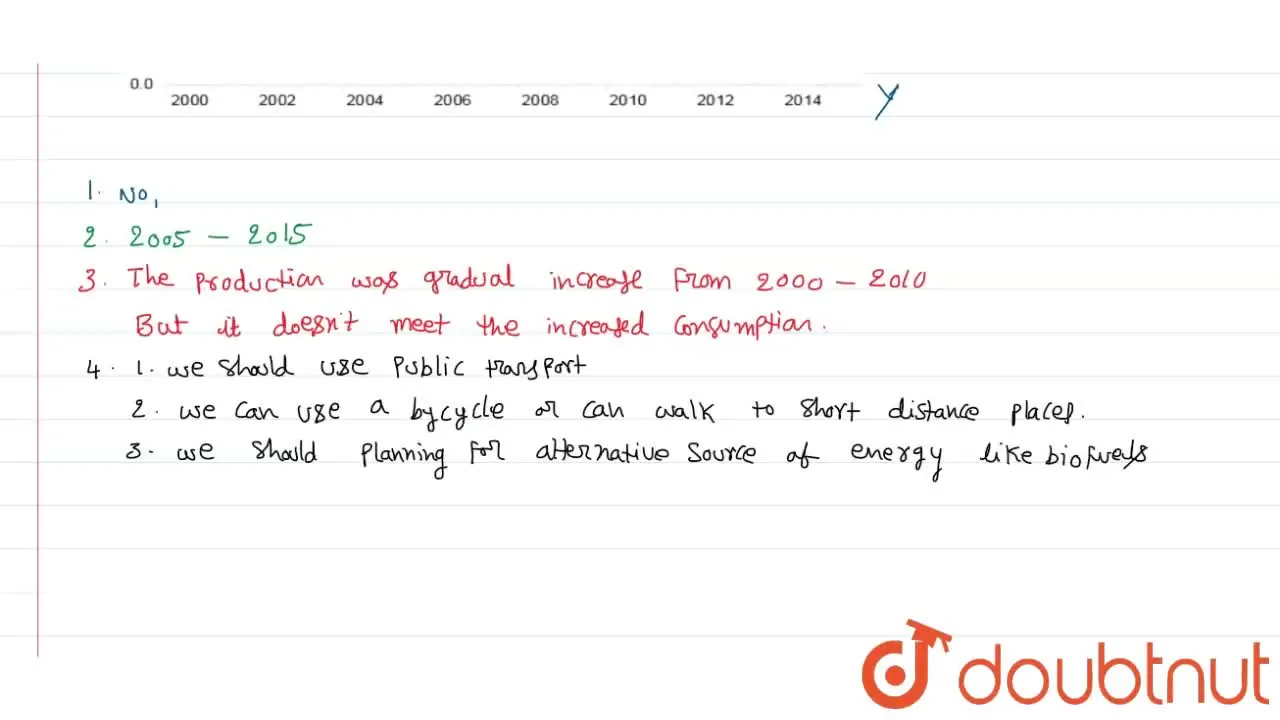
Collect any graph that shows oil (petroleum) consumption in India.
i) Does the production meet consumption in India ?
ii) During which period of time shows highest increase in consumption rate ?
iii) What will you say happened to production from past ten years, for example 2004 to 2014 ?
iv) Suggest some ways to bring down consumption of petroleum.Solution in Telugu
Step by step video & image solution for Collect any graph that shows oil (petroleum) consumption in India. i) Does the production meet consumption in India ? ii) During which period of time shows highest increase in consumption rate ? iii) What will you say happened to production from past ten years, for example 2004 to 2014 ? iv) Suggest some ways to bring down consumption of petroleum. by Biology experts to help you in doubts & scoring excellent marks in Class 10 exams.
Related Playlists
- BOOK - NCERT TELUGUCHAPTER - NATURAL RESOURCESEXERCISE - FILL IN THE BLANKS5videos
NATURAL RESOURCES
- BOOK - NCERT TELUGUCHAPTER - NATURAL RESOURCESEXERCISE - CHOOSE THE CORRECT ANSWER5videos
NATURAL RESOURCES
- BOOK - NCERT TELUGUCHAPTER - NATURAL RESOURCESEXERCISE - MEDICINE ORIENTED MATERIAL27videos
NATURAL RESOURCES
- BOOK - NCERT TELUGUCHAPTER - MOSQUITOES WOESEXERCISE - ENVIRONMENTAL EDUCATION5videos
MOSQUITOES WOES
- BOOK - NCERT TELUGUCHAPTER - NATURE IS A SACRED PLACEEXERCISE - ENVIRONMENTAL EDUCATION3videos
NATURE IS A SACRED PLACE
Similar Questions
................... plants are used for production of biofuel.
02:54View SolutionPercolation tanks helps to
06:01View SolutionOzone hole is
07:01View SolutionPrepare a chart showing the symptoms of diseases spread by mosquitoes.
02:07View SolutionWhy should we consider nature is a sacred place? Why sacred places are becoming polluted?
01:50View SolutionState any five steps to reduce the consumption of coal and petroleum products.
04:42View SolutionCONSUMPTION, PATTERN OF ENERGY IN INDIA
View SolutionCollect any graph that shows oil (petroleum) consumption in India.
i) Does the production meet consumption in India ?
ii) During which period of time shows highest increase in consumption rate ?
iii) What will you say happened to production from past ten years, for example 2004 to 2014 ?
iv) Suggest some ways to bring down consumption of petroleum.View SolutionDraw a pie diagram showing percentage consumption of some resources in India.
View SolutionCoal consumption of world : 41 % : : coal consumption in India : ...................
View SolutionCollect and examine any graph indicating petroleum consumption in our country
View SolutionConsumption of chemical fertilisers is highest in which state of India?
01:23View SolutionConsumption of chemical fertilisers is highest in which state of India?
View Solutionஉலக அளவில் கச்சா எண்ணெய் பயன்படுத்தலில் _________ பெரிய நாடு இந்தியாவாகும்.
01:42View SolutionAt present consumption rate, the petroleum resources of the world will last for another
01:57View SolutionConsumption of chemical fertilisers is highest in which state of India?
02:04View Solution


