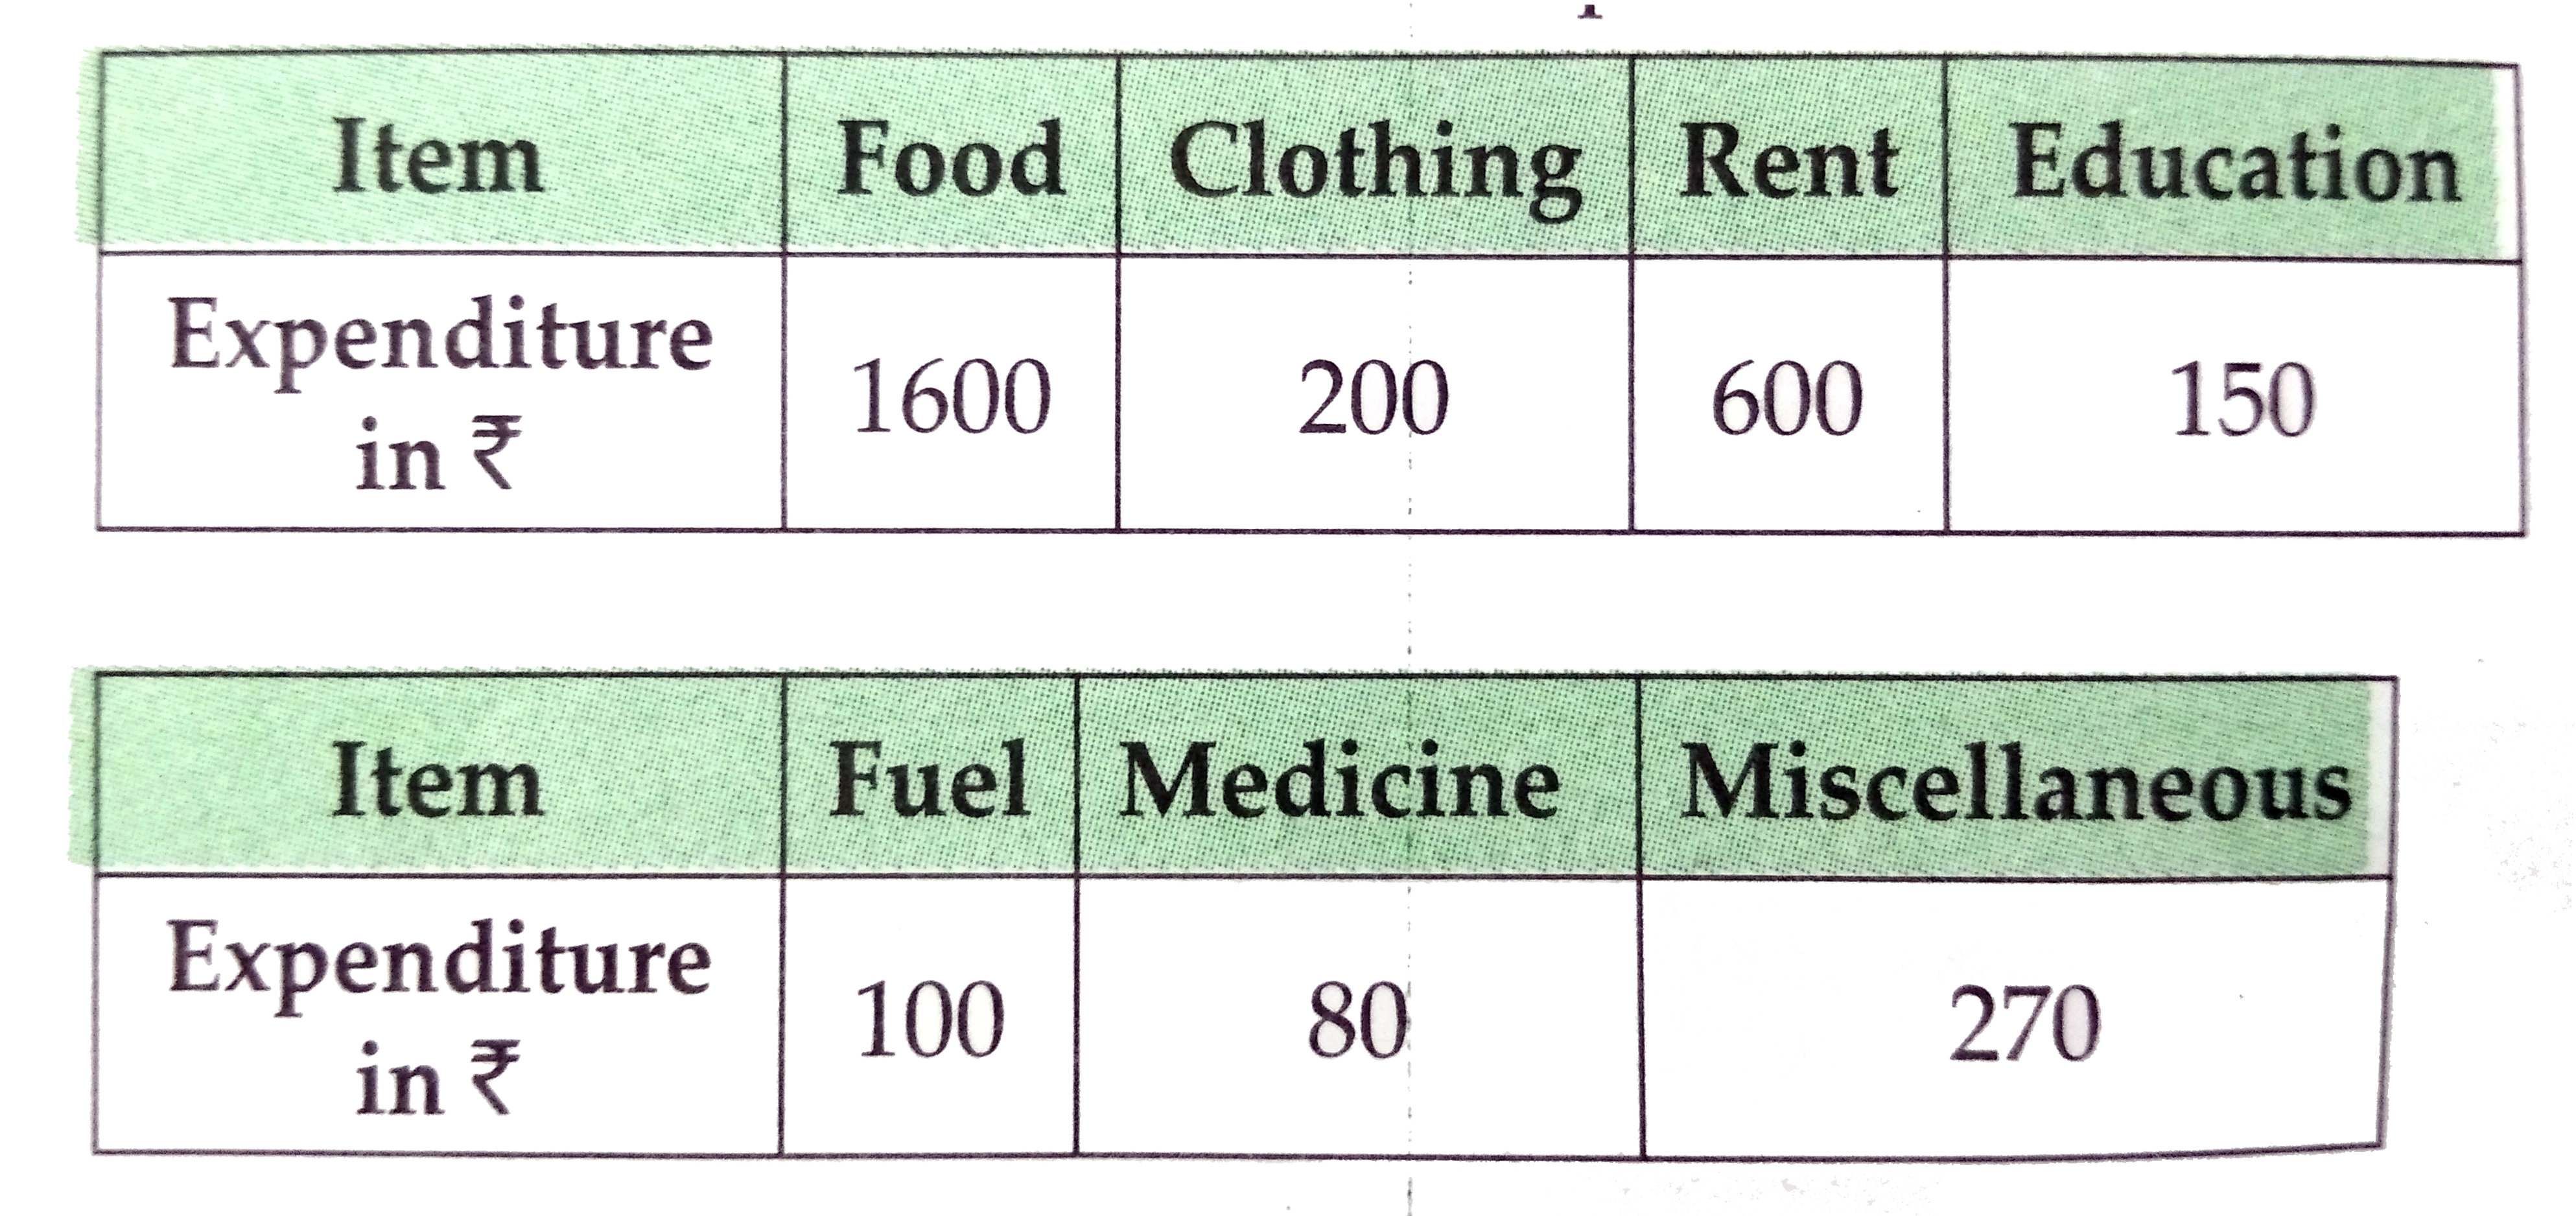
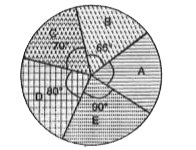
Draw a pie diagram showing percentage consumption of some resources in India.Solution in Telugu
Topper's Solved these Questions
- NATURAL RESOURCESBook:VGS PUBLICATION-BRILLIANTChapter:NATURAL RESOURCESExercise:EXERCISE
Explore 252 Videos
- NATURAL RESOURCESBook:VGS PUBLICATION-BRILLIANTChapter:NATURAL RESOURCESExercise:CREATIVE QUESTIONS FOR NEW MODEL PAPER (2 MARK QUESTIONS)
Explore 31 Videos
- MOSQUITOESS WOESBook:VGS PUBLICATION-BRILLIANTChapter:MOSQUITOESS WOESExercise:EXERCISE
Explore 3 Videos
- NATURE IS A SACRED PLACEBook:VGS PUBLICATION-BRILLIANTChapter:NATURE IS A SACRED PLACEExercise:Fill in the blanks
Explore 14 Videos
Similar Questions
The BP Statistical Review of World Energy in June measured total global oil at 188.8 million tonnes, from proved oil resources at the end of 2010. This is only enough for oil to last for the next 46.2 years, What measures should be taken to conserve oil ? What will happen if we do not conserve it ?
View SolutionRahul remarked that different human activities are responsible for global warming. What might be the resasons for his statement ?
View SolutionWhich of the following disease is caused by mosquito bite?
View SolutionWe believe in…………
View SolutionThe following table shows the percentage of vehicles passing a signal. Find out the measures of the central angles to show the information by a pie diagram. Hence draw the pie diagram.

View SolutionThe following table shows the percentages of demands for different fruits registered with a fruit vendor. Show the information by a pie diagram.

View SolutionThe percentage of expenditure on different heads in a budget of a state is as shown below :

Draw a pie diagram to represent the information .
View SolutionThe following table shows the percentages of demands for different fruits registered with a fruit vendor. Show the information by a pie diagram.

View SolutionFollowing is the breakup of expenditure of a family on different times of consumption.

Draw a pie diagram of the above data.
View SolutionThe following table shows the percentages of demands for different fruits registered with a fruit vendor. Show the information by a pie diagram.

View SolutionCoal consumption of world : 41 % : : coal consumption in India : ...................
View Solutionकिसी जिले के एक गौ में विभिन्न उत्पादों का प्रतिशत नीचे दिया गया है इस जाकारी को प्रदर्शित करता हुआ एक पाई आरेख खींचिए।

View Solutionनीचे दिए गए आंकड़ों से पाई आरेख खींचिए।

View Solutionनीचे दिए गए आंकड़ों से पाई आरेख खींचिए।

View Solutionनीचे दिए गए पाई आरेख में चार शहरो की साक्षरता को दिखाया गया है शहर A की साक्षरता का प्रतिशत ज्ञात कीजिए।

View Solution


