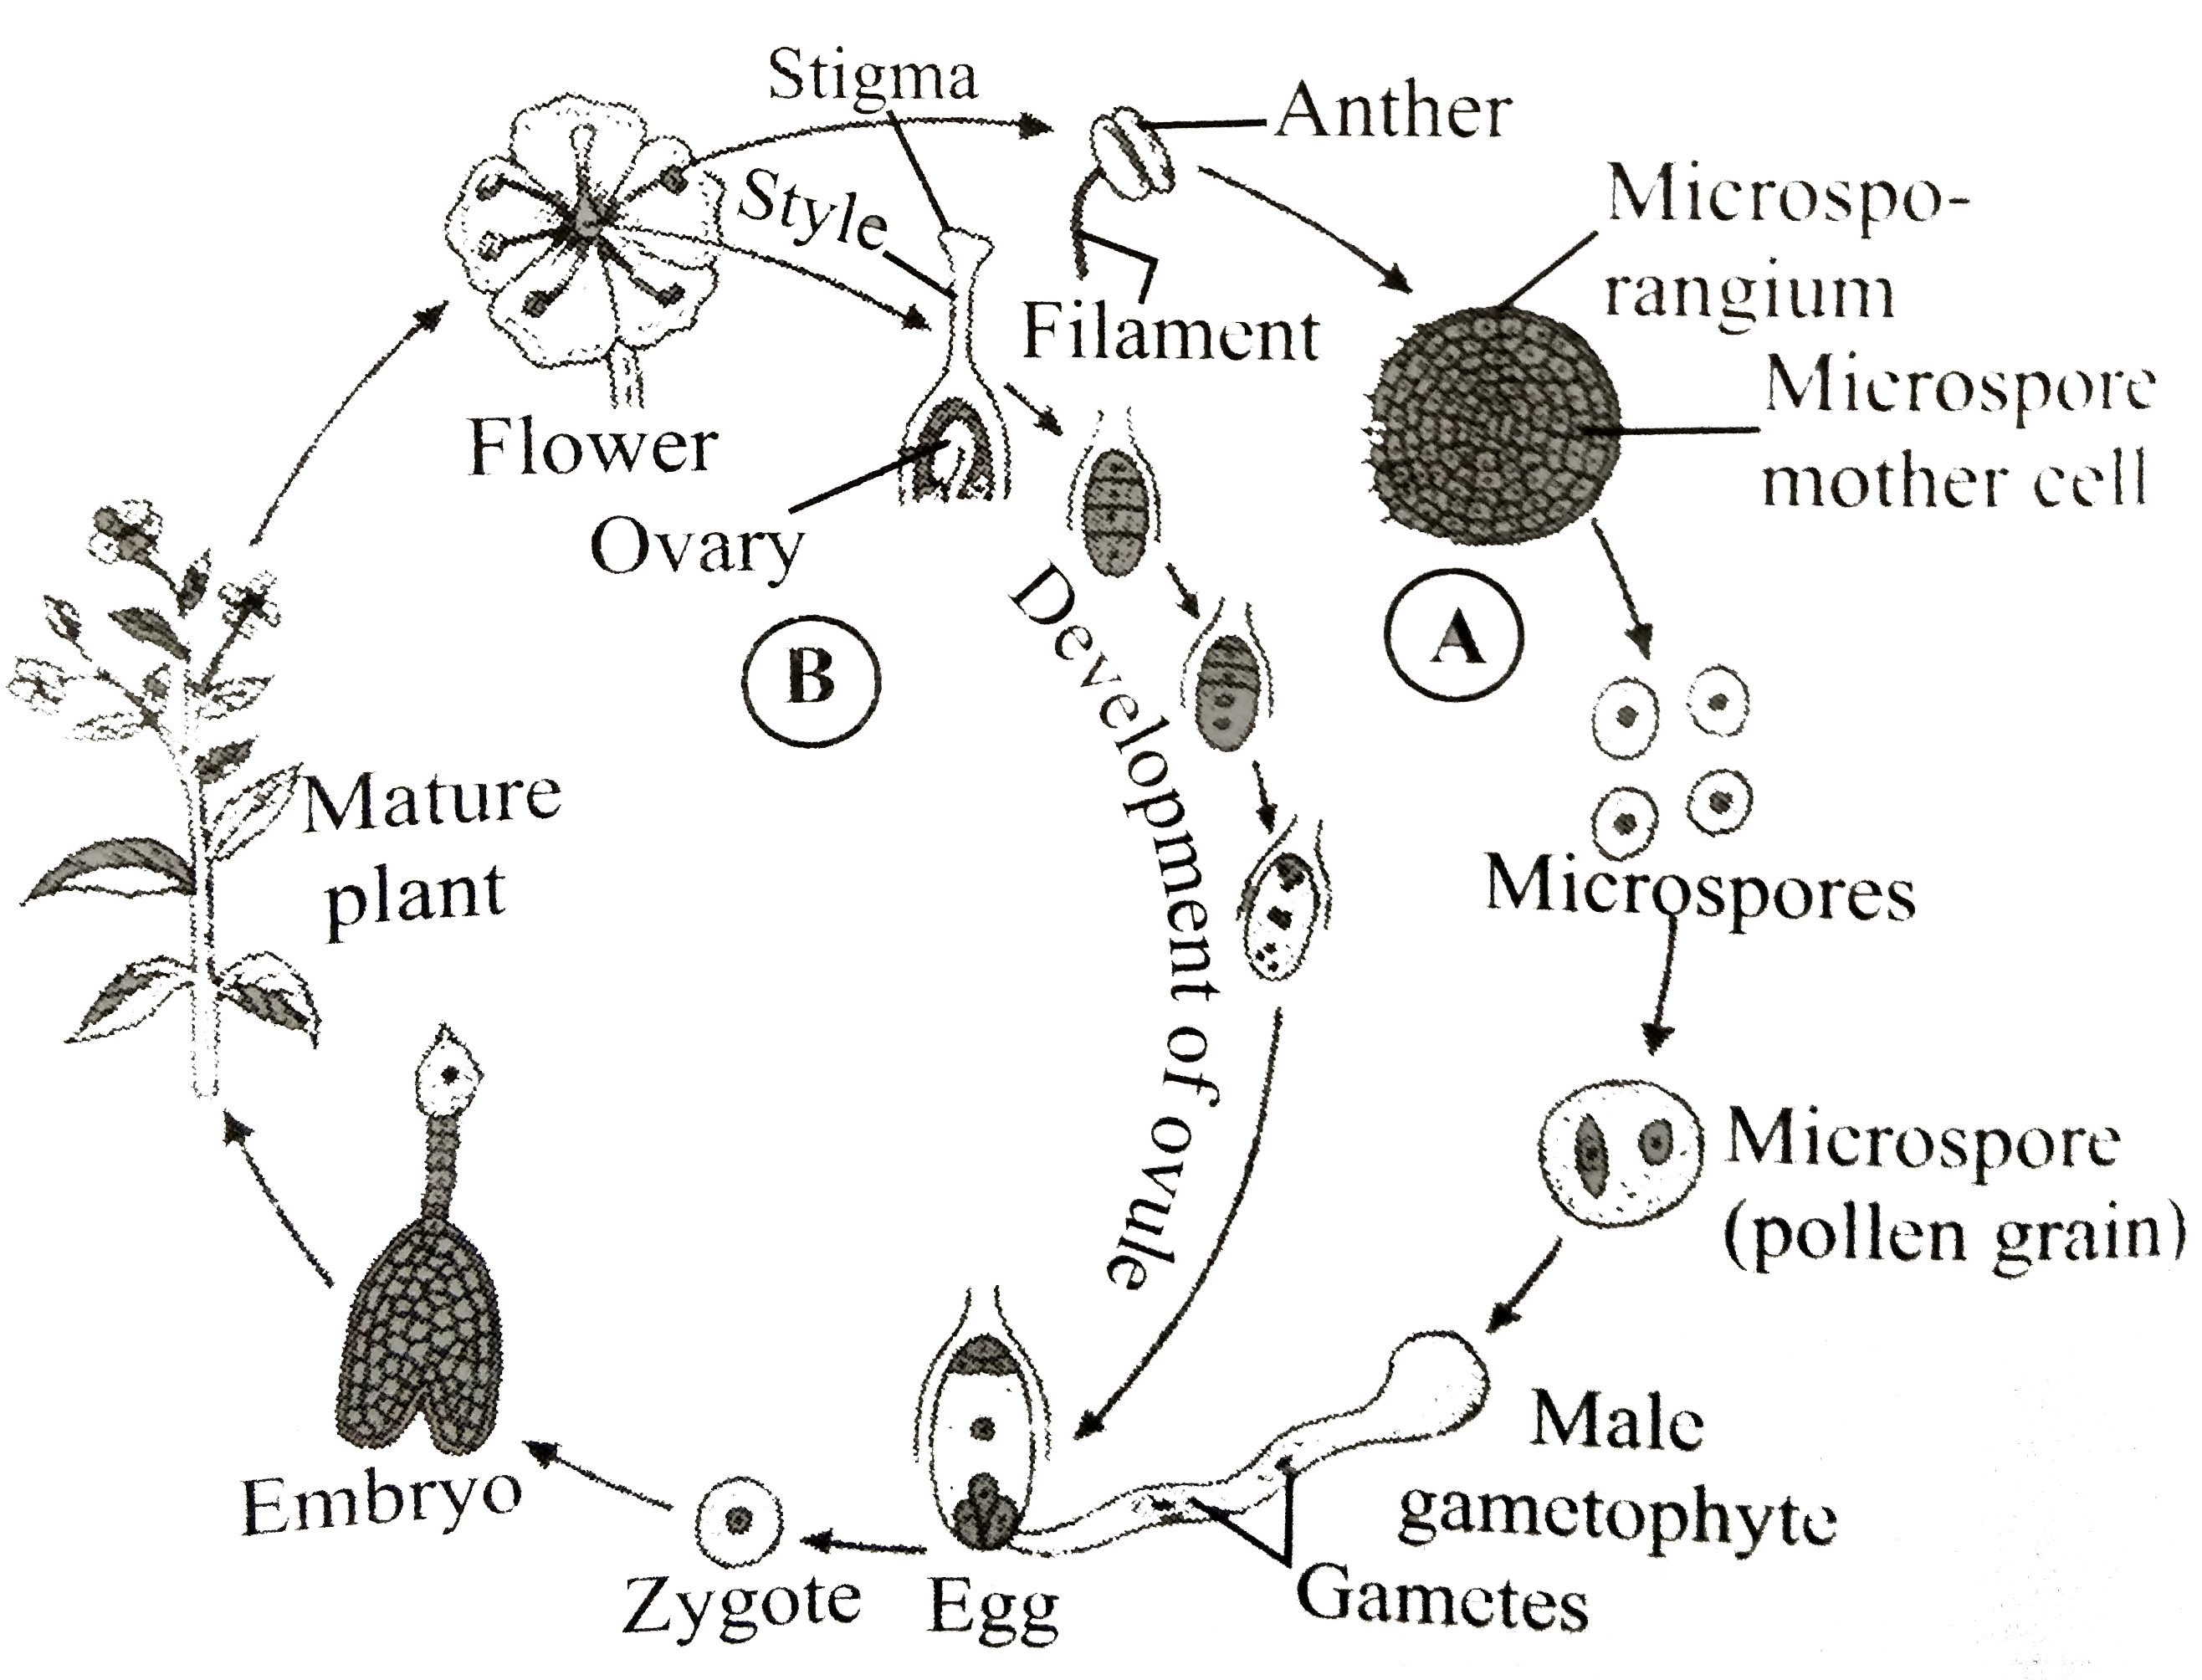
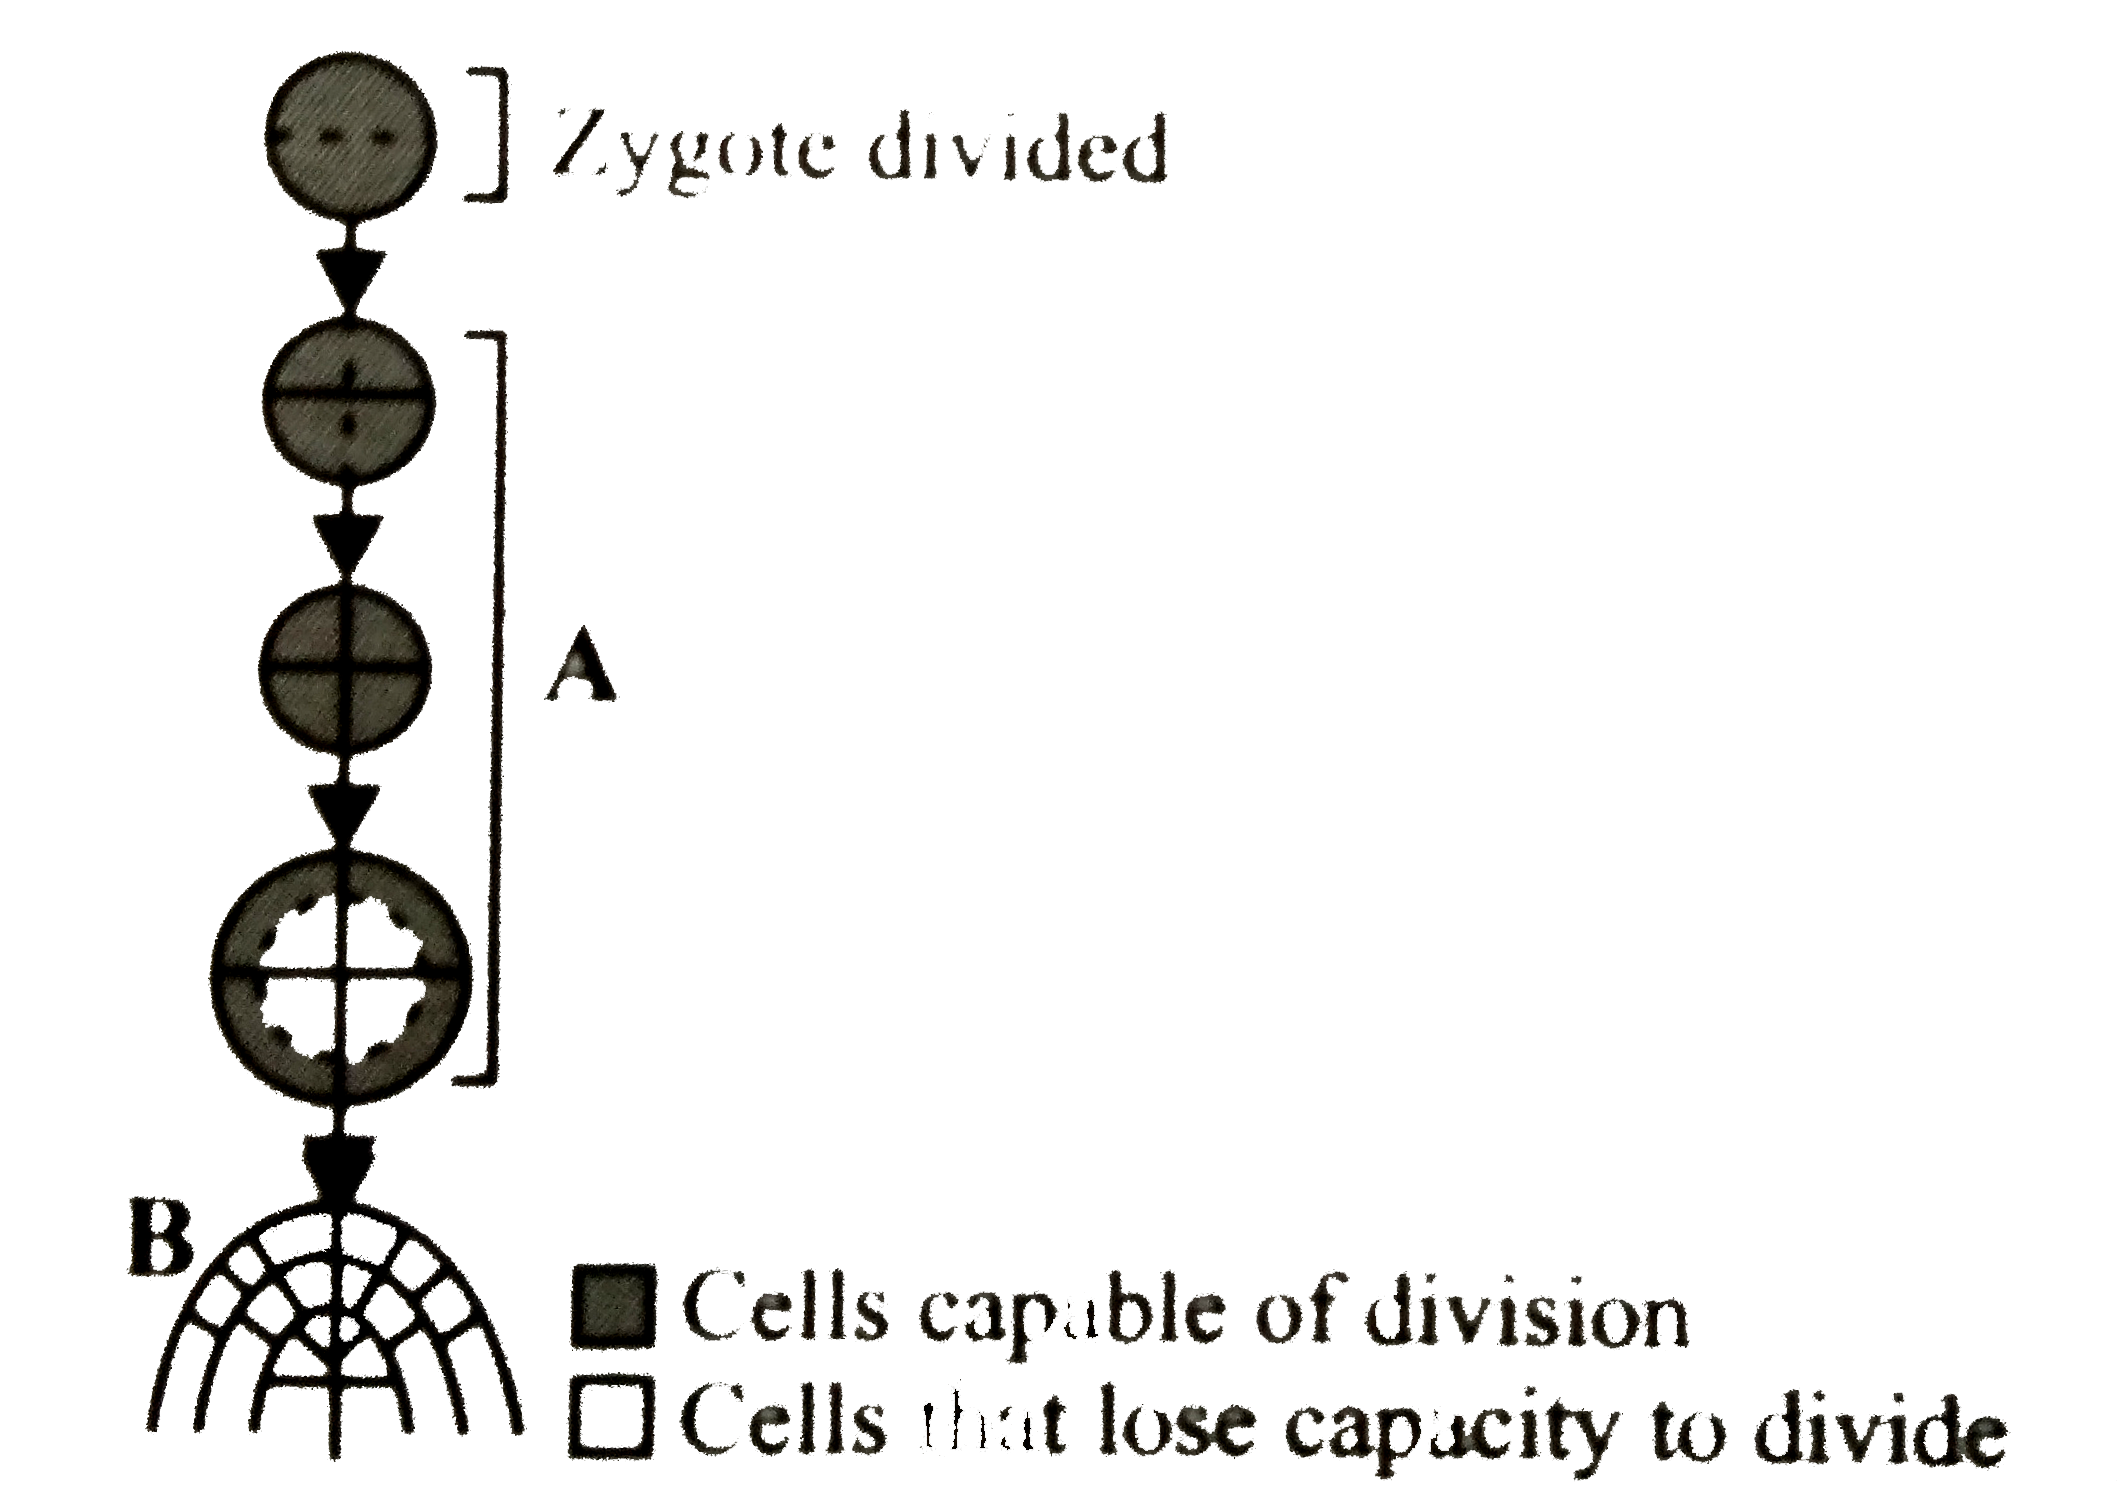
The given figure shows to phases, A and B of a typical angiospermic life cycle. Select the correct option regarding it.Solution in Odia
ABGametophytic generration (n)Sporophytic generation (2n)
ABSporophytic generation (2n)Gametophytic generation (n)
ABSporophytic generation (2n)Sporophytic generation (2n)
ABGametophytic generration (n)Gametophytic generation (n)
The correct Answer is:A
Step by step video & image solution for The given figure shows to phases, A and B of a typical angiospermic life cycle. Select the correct option regarding it. by Biology experts to help you in doubts & scoring excellent marks in Class 11 exams.
Updated on:21/07/2023Similar Questions
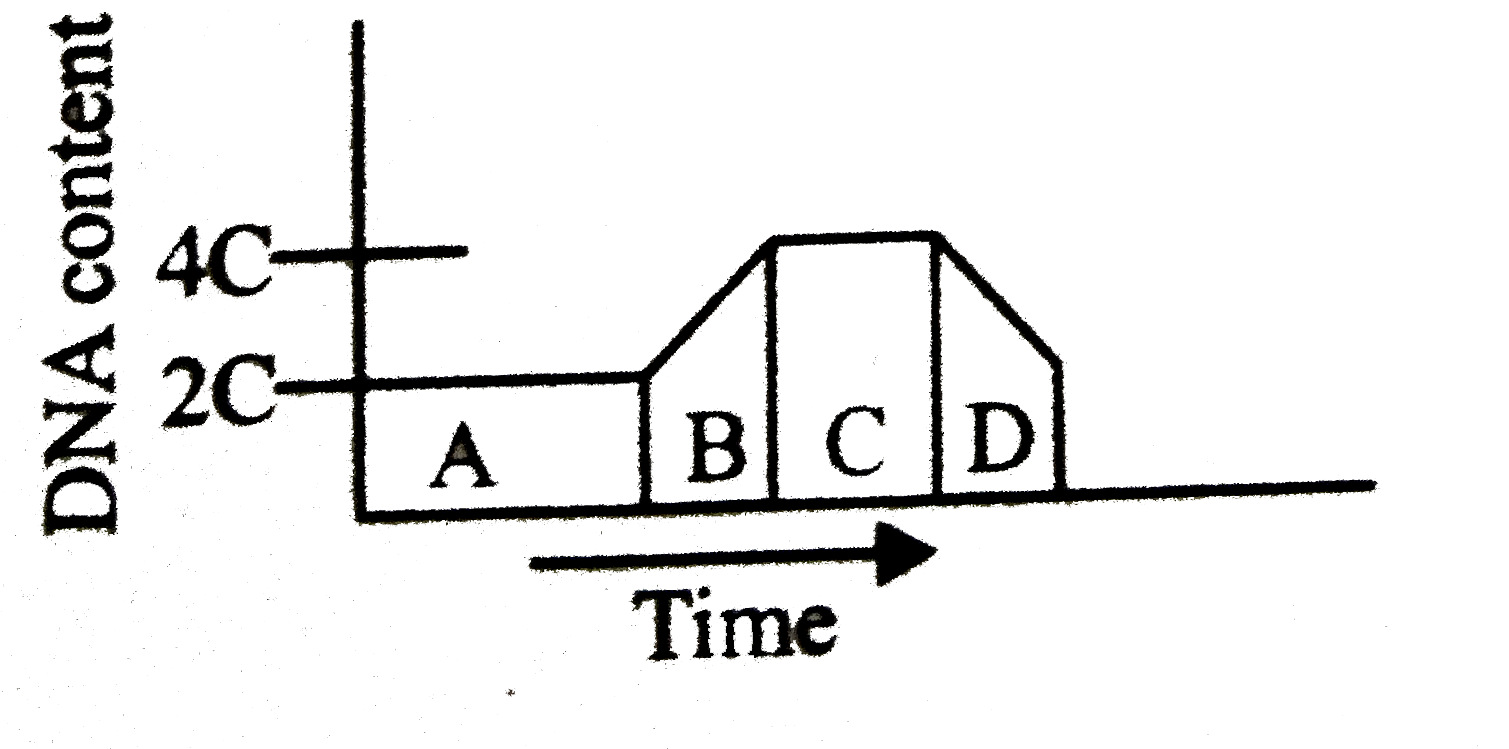
The given graph shows the change in DNA content during various phases (A to D) in a typical mitotic cell cycle. Identify the phases and select the correct option.
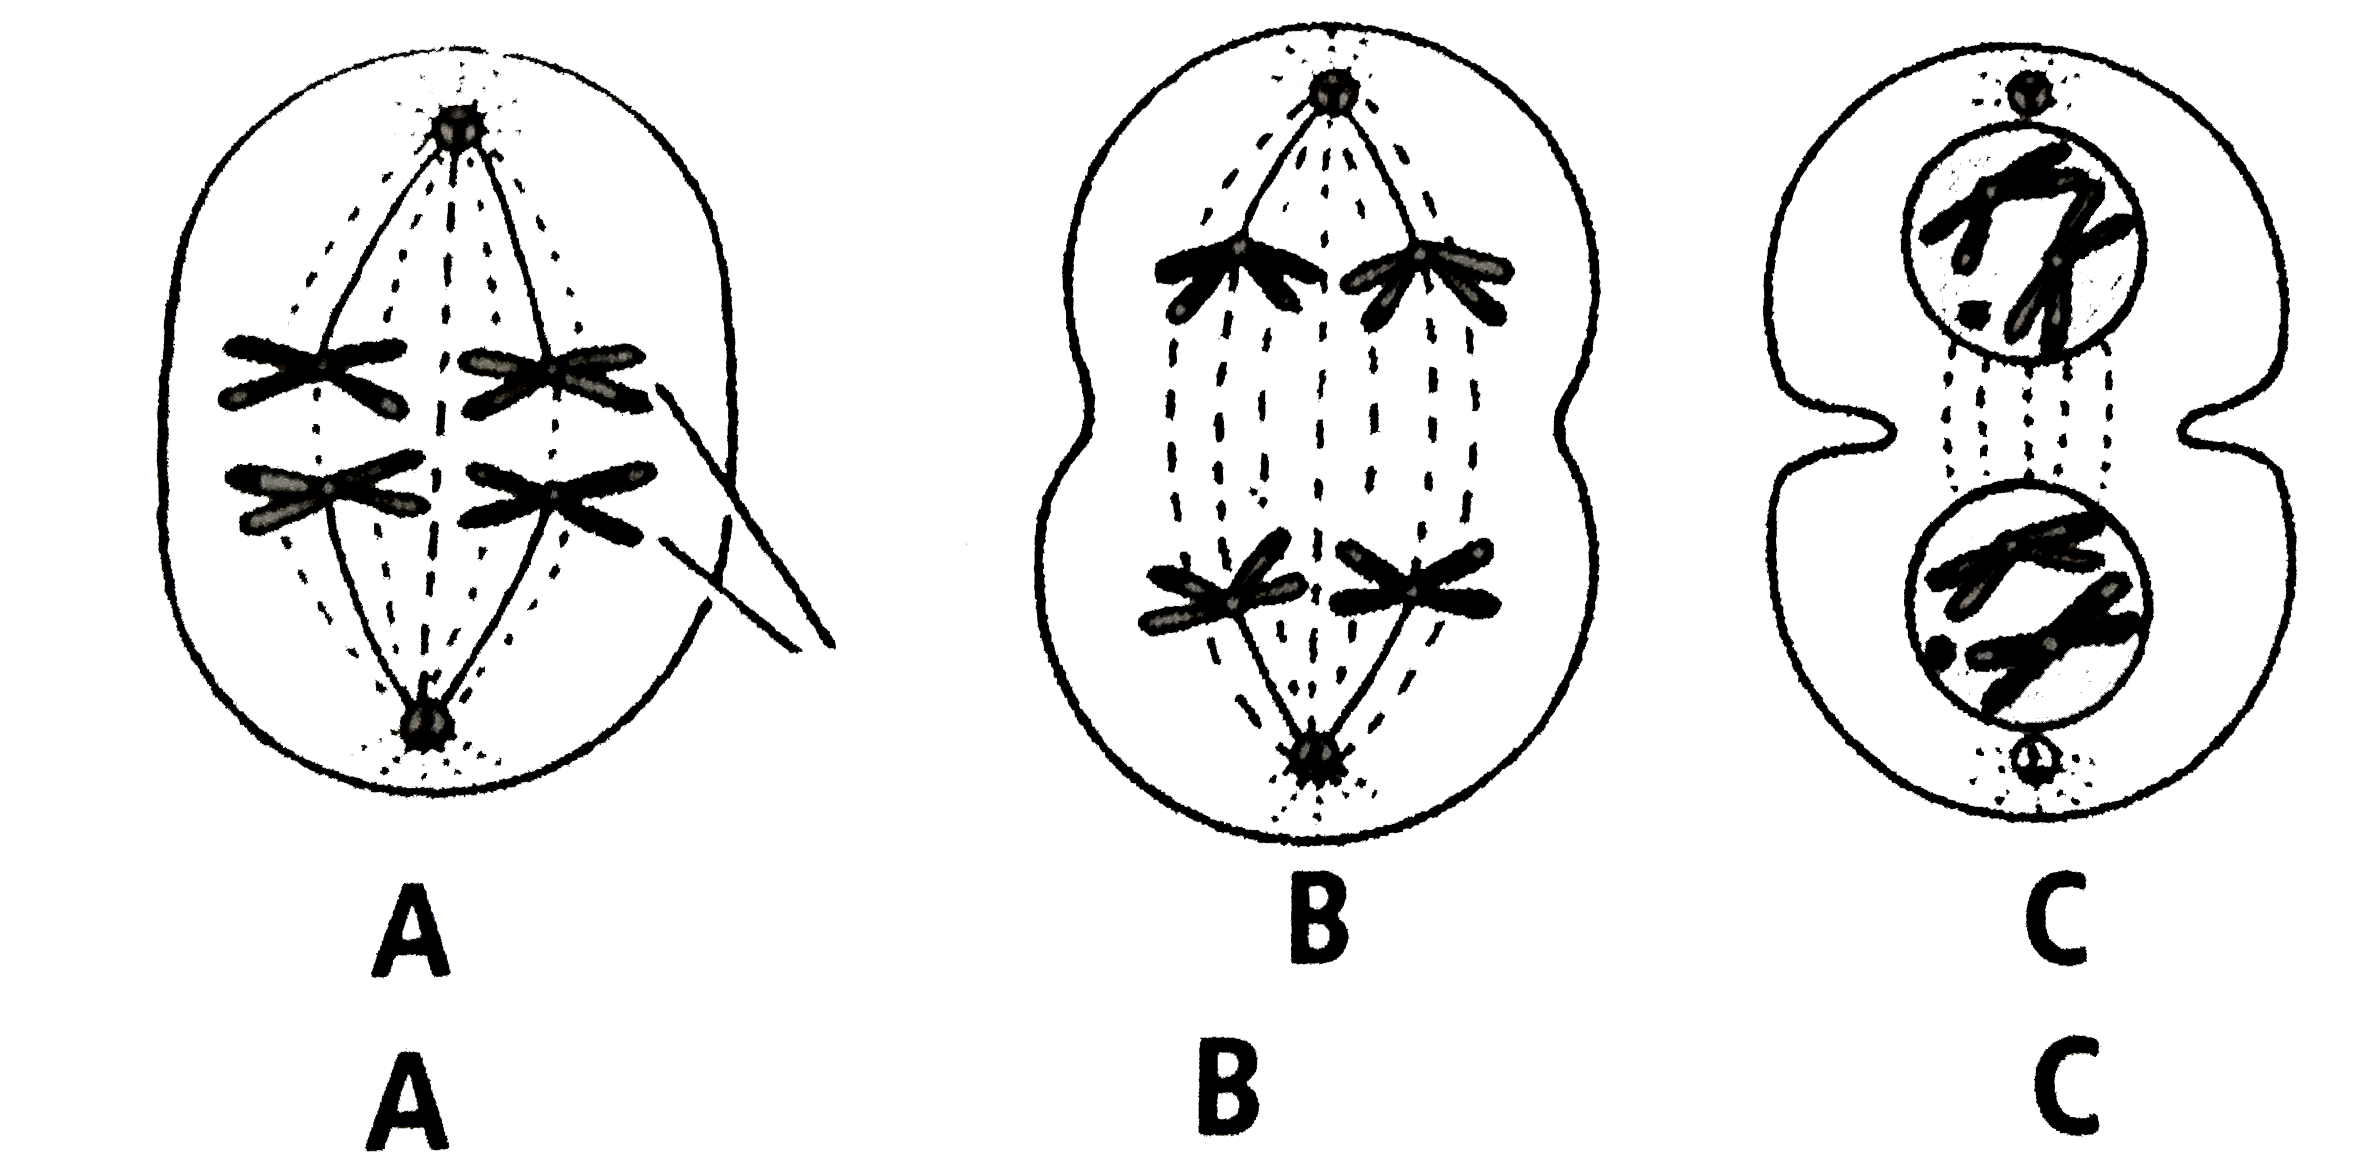
View SolutionIdentify the given figures showing meiotic phases and select the correct option.
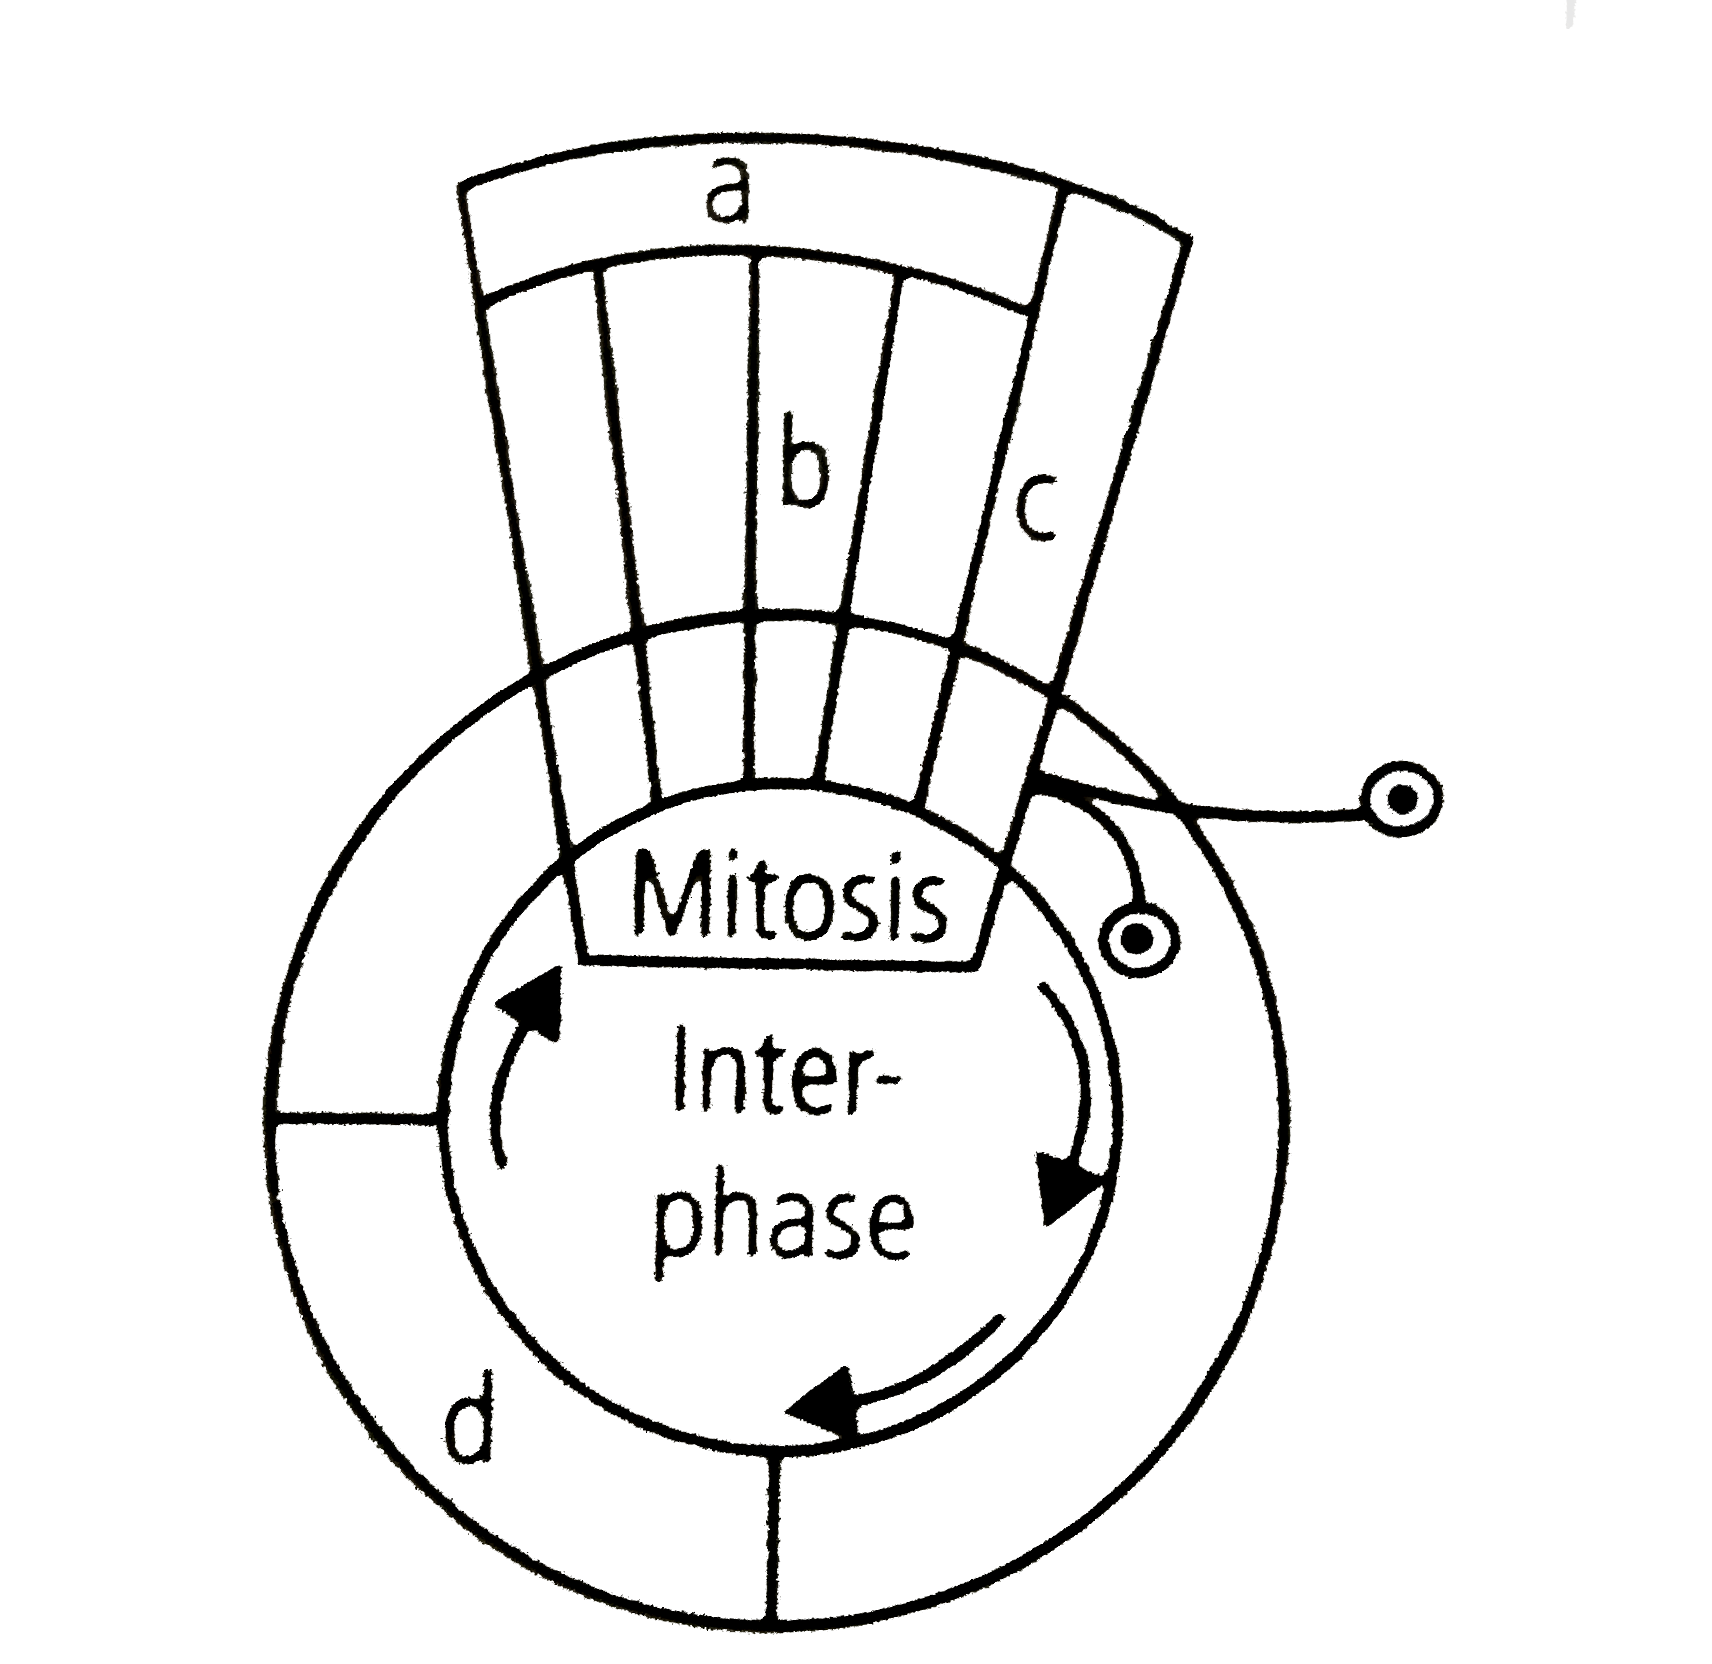
View SolutionThe given figure is a schematic breadk-up of the phases/stages of cell cycle. Select the correct option regarding it.
View SolutionThe given figure shows development of an embryo that undergoes two phases A and B. select the correct option regarding it.
View SolutionSelect the correct option regarding the given figure
View SolutionSelect the correct option showing the life cycle of Plasmodium.
View SolutionThe given graph shows the change in DNA content during various phases (A to D) in a typical mitotic cell cycle. Identify the phases and select the correct option.

View SolutionIdentify the given figures showing meiotic phases and select the correct option.

View Solution