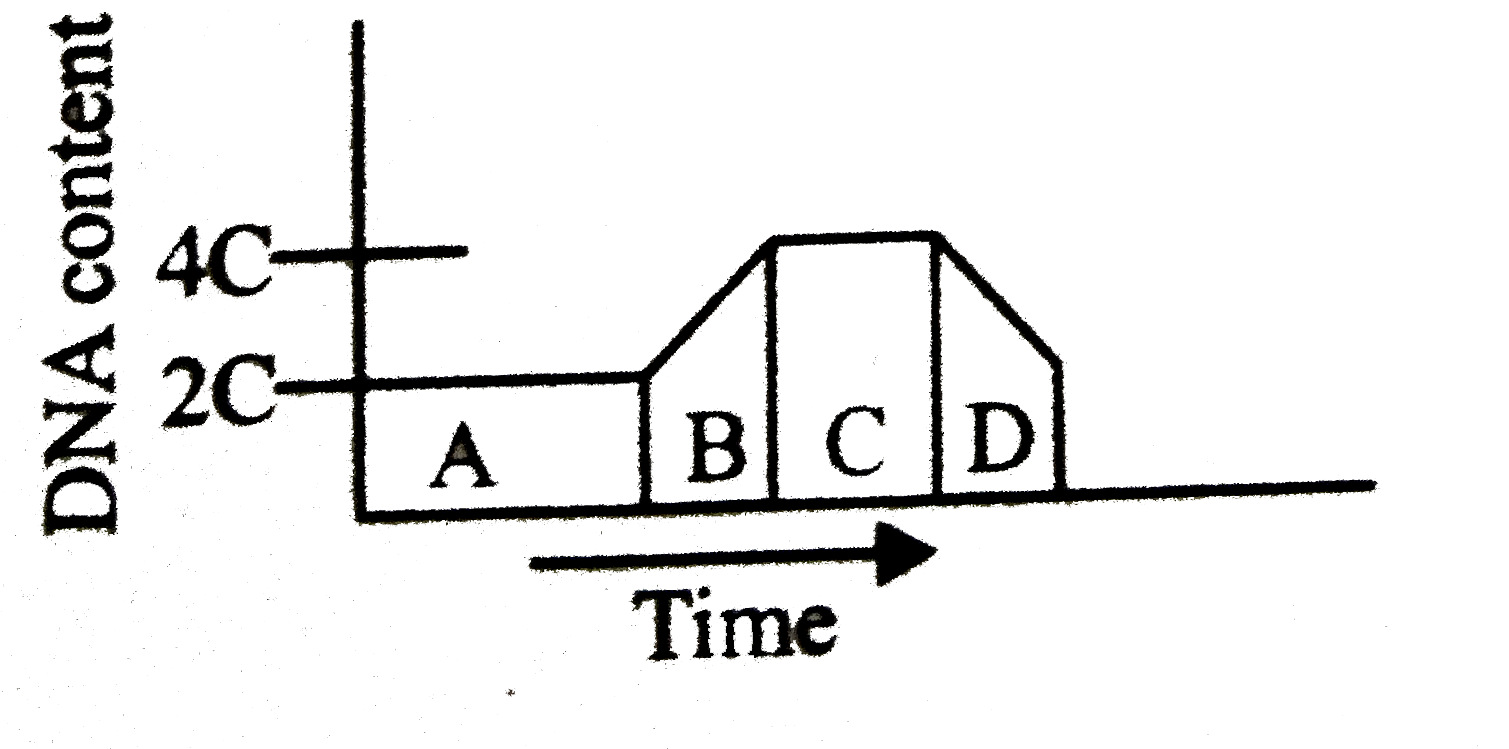
The given graph shows the change in DNA content during various phases (A to D) in a typical mitotic cell cycle. Identify the phases and select the correct option.
A
ABCDG2G1SM
B
ABCDG2SG1M
C
ABCDG1SG2M
D
ABCDMG1SG2
Video Solution
Text Solution
The correct Answer is:C
During G1 phase, DNA contnet is 2C. S phase is marked by replication of DNA and the amount of DNA per cell is doubled. During G2 phase, synthesis of RNA and proteins takes place. During mitosis, DNA content gets equally distributted among two daughter cells.
|
Topper's Solved these Questions
Similar Questions
Knowledge Check
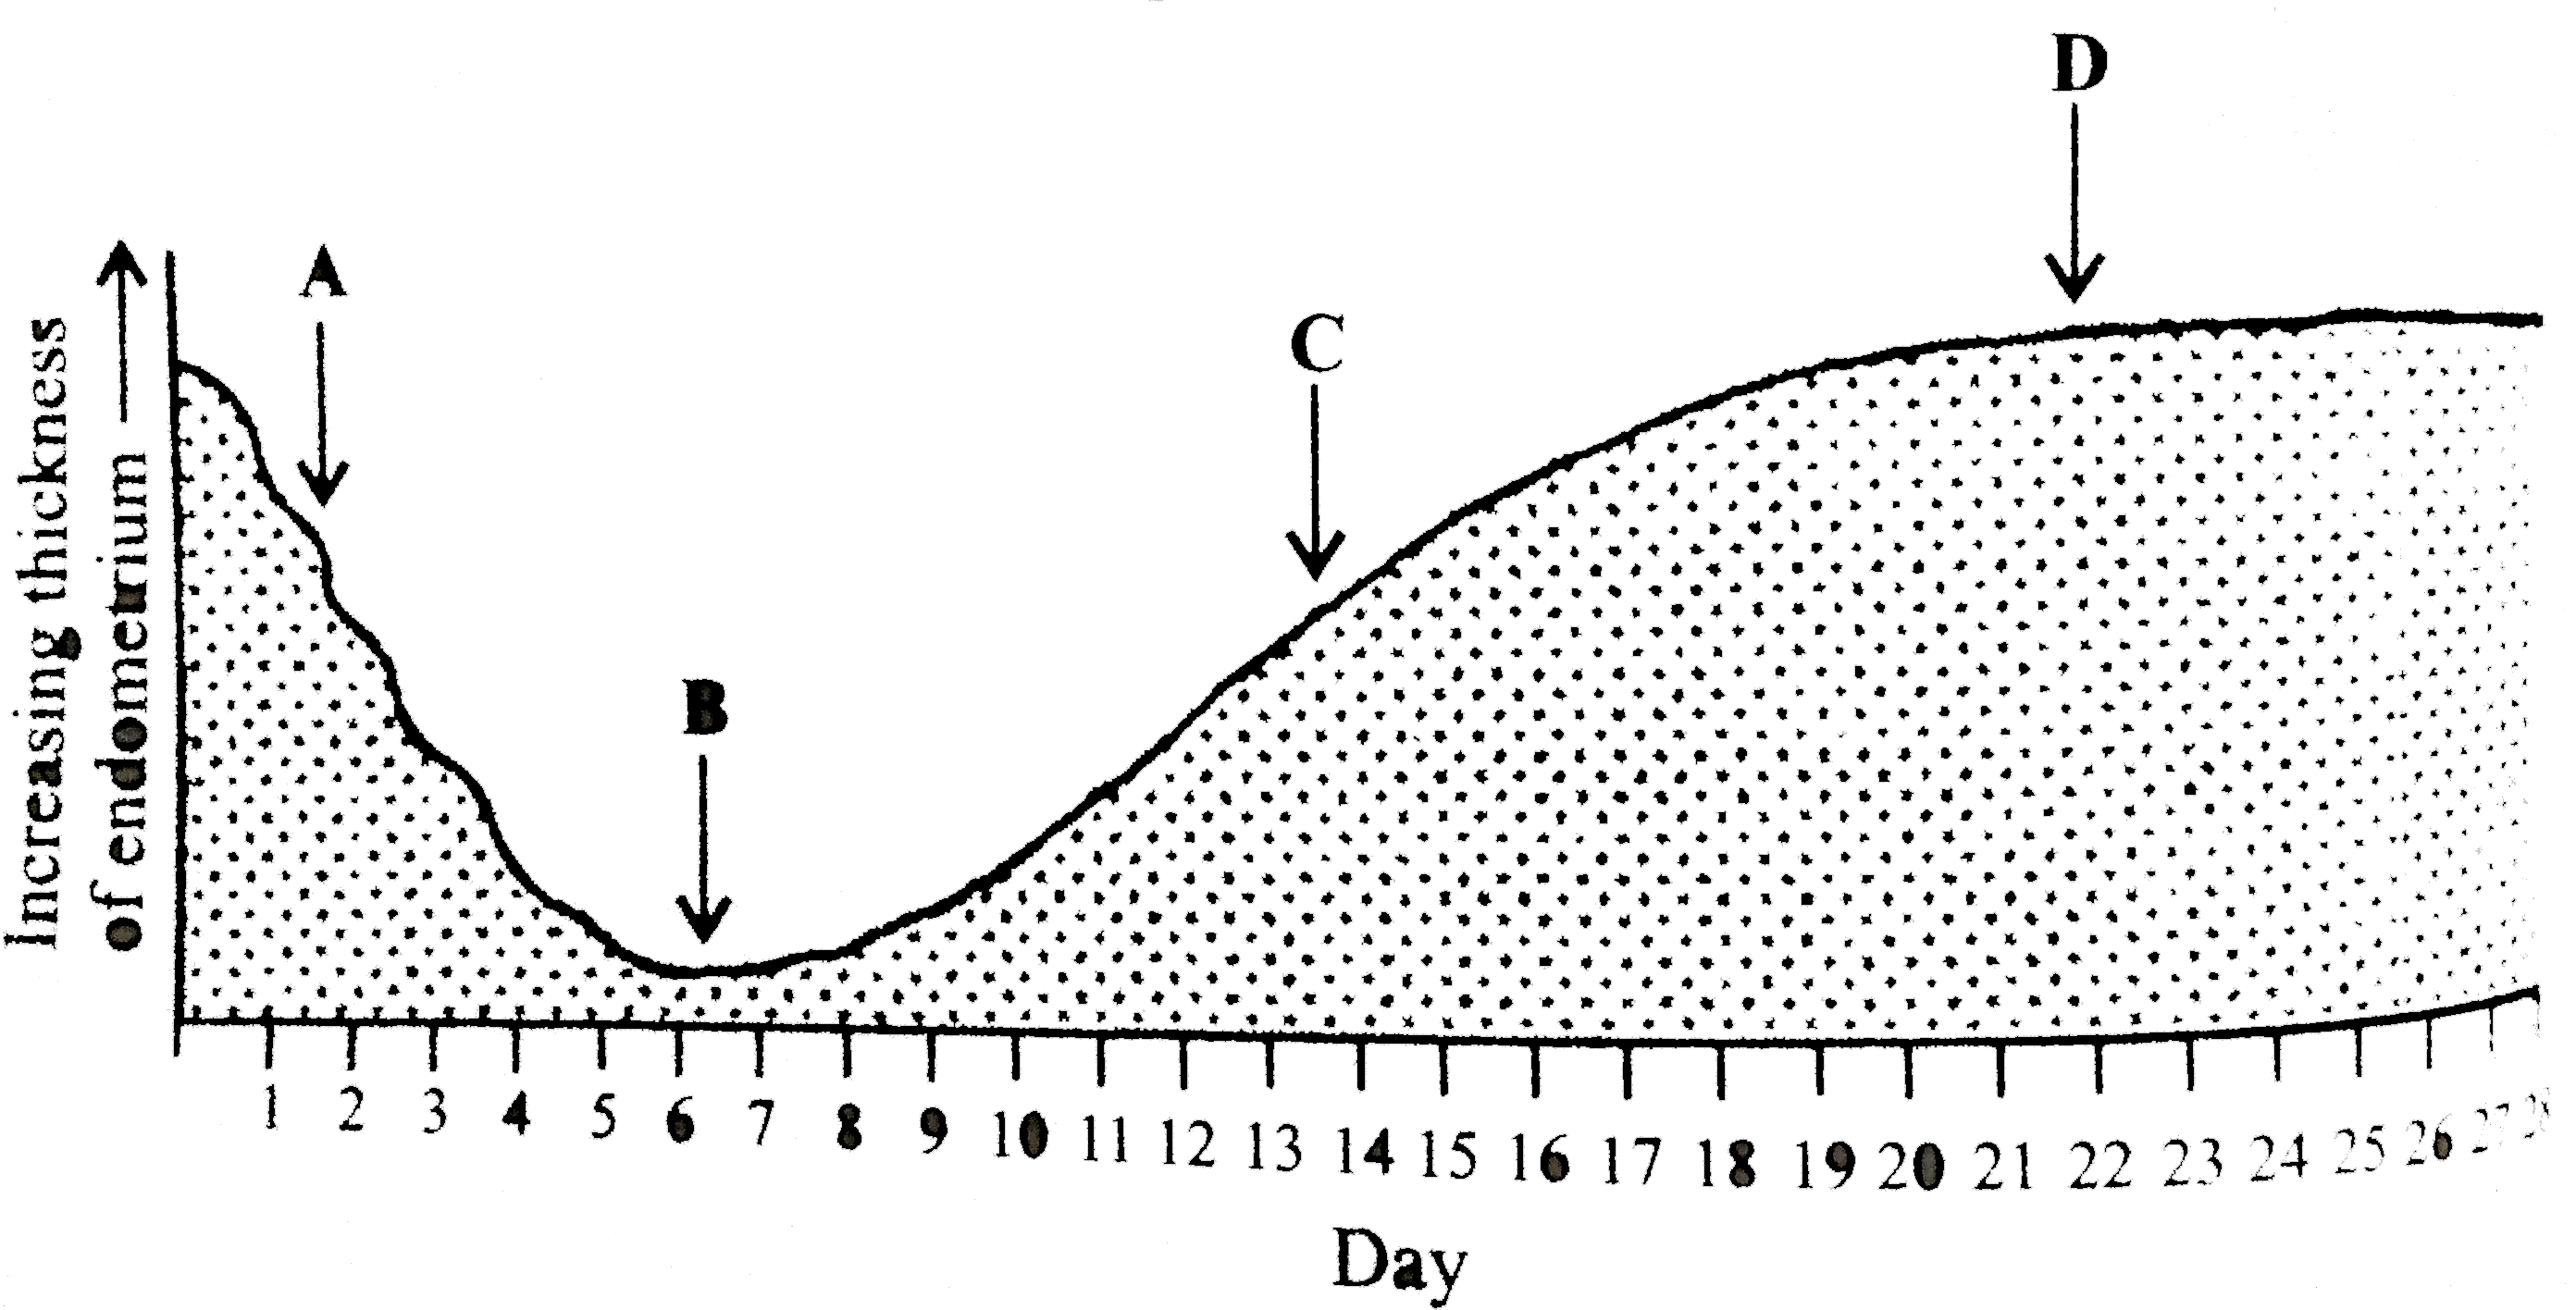
The accompanying diagram shows the changes that take place in the endometrium during a normal menstrual cycle. Identify the changes and select the correct option.AOvulationMenstruationABBOvulationMenstruationACCOvulationMenstruationCADOvulationMenstruationBDThe given graph shows the change in DNA content in a single cell during the mitosis which stage occurs between the time x and y ?
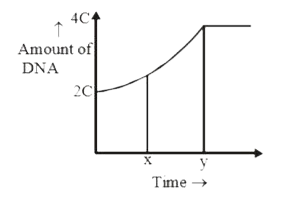 AInterphaseBProphaseCAnaphaseDTelophase
Given figure represents the ultrastructure of a typical cyanobacterial cell. Identify the different parts and select the correct option for A and B
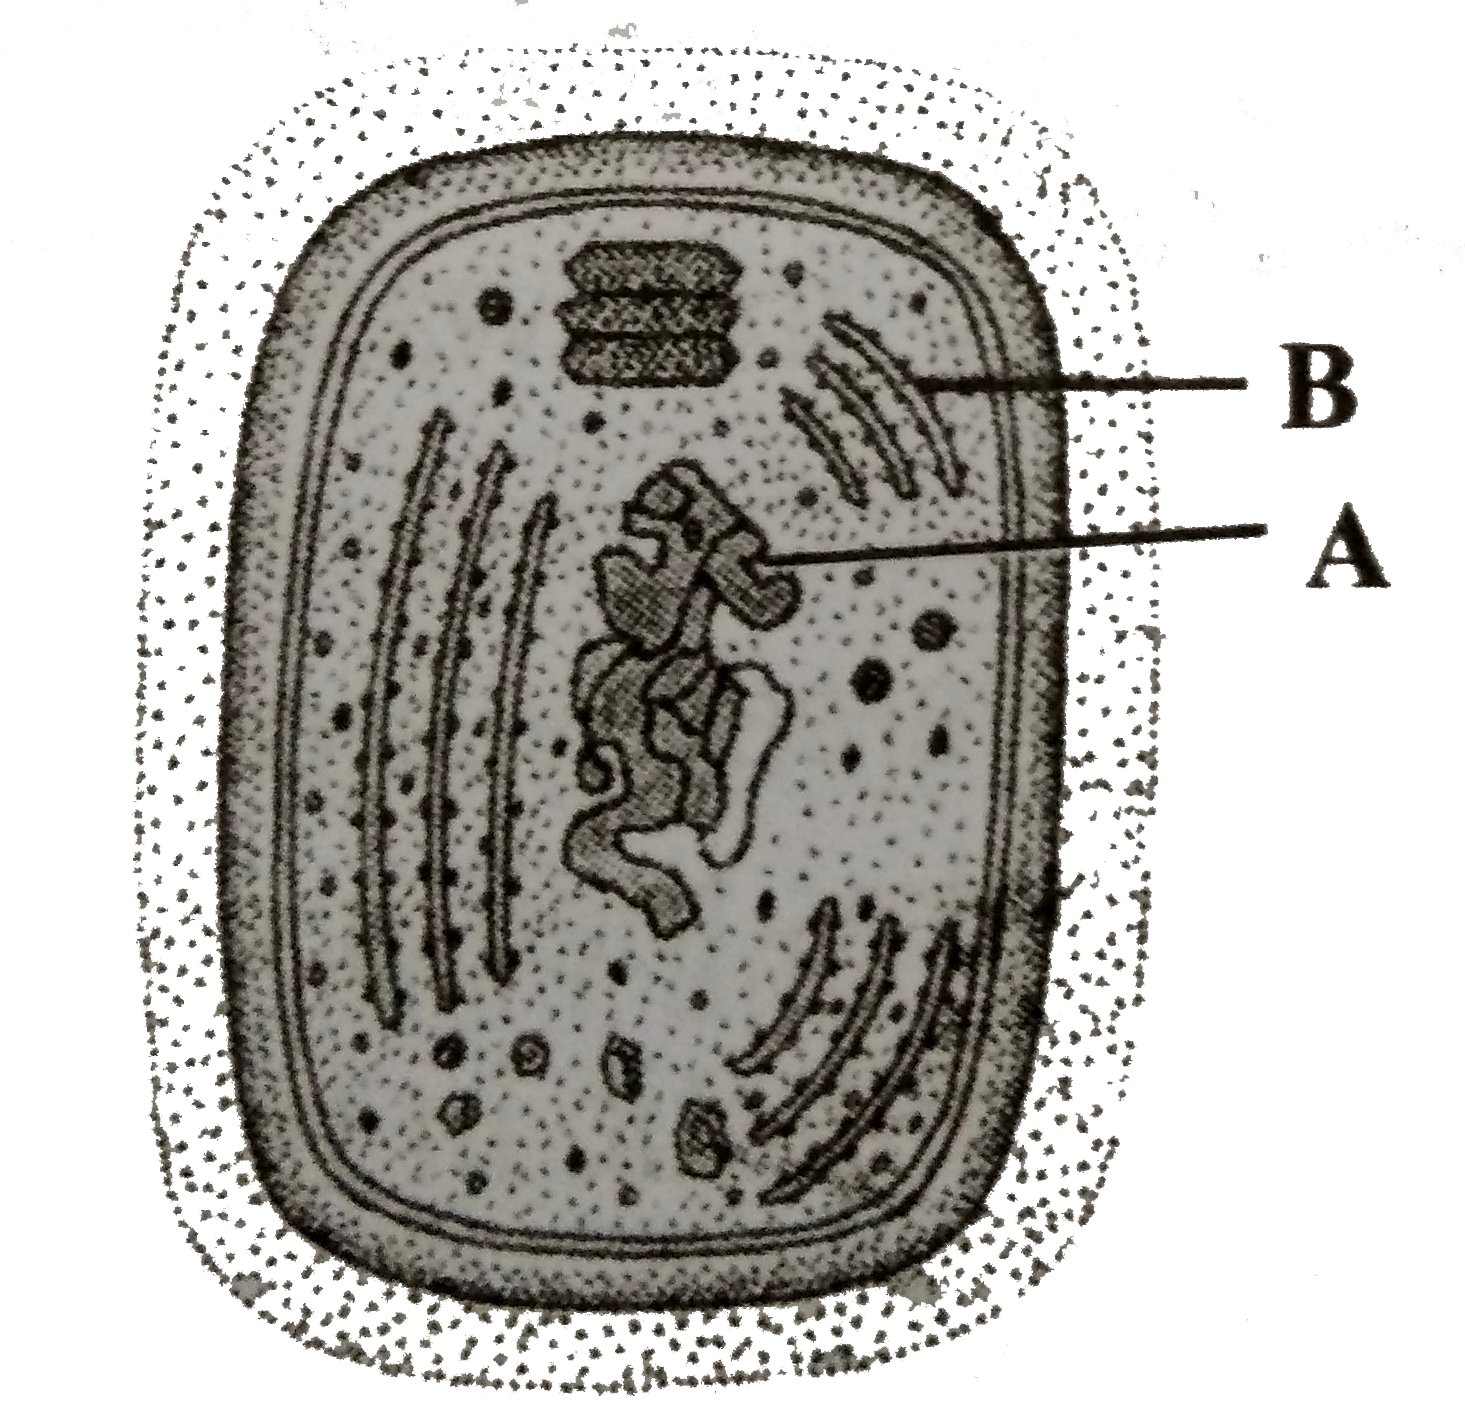 AAB(a)Naked DNAThylakoidBAB(b)ThylakoidNaked DNACAB(c)DNA+HistonesThylakoidDAB(d)DNA+Histone80S ribosomes
Identify A,B,C and D in the given diagram depicting cell cycle and select the correct option.
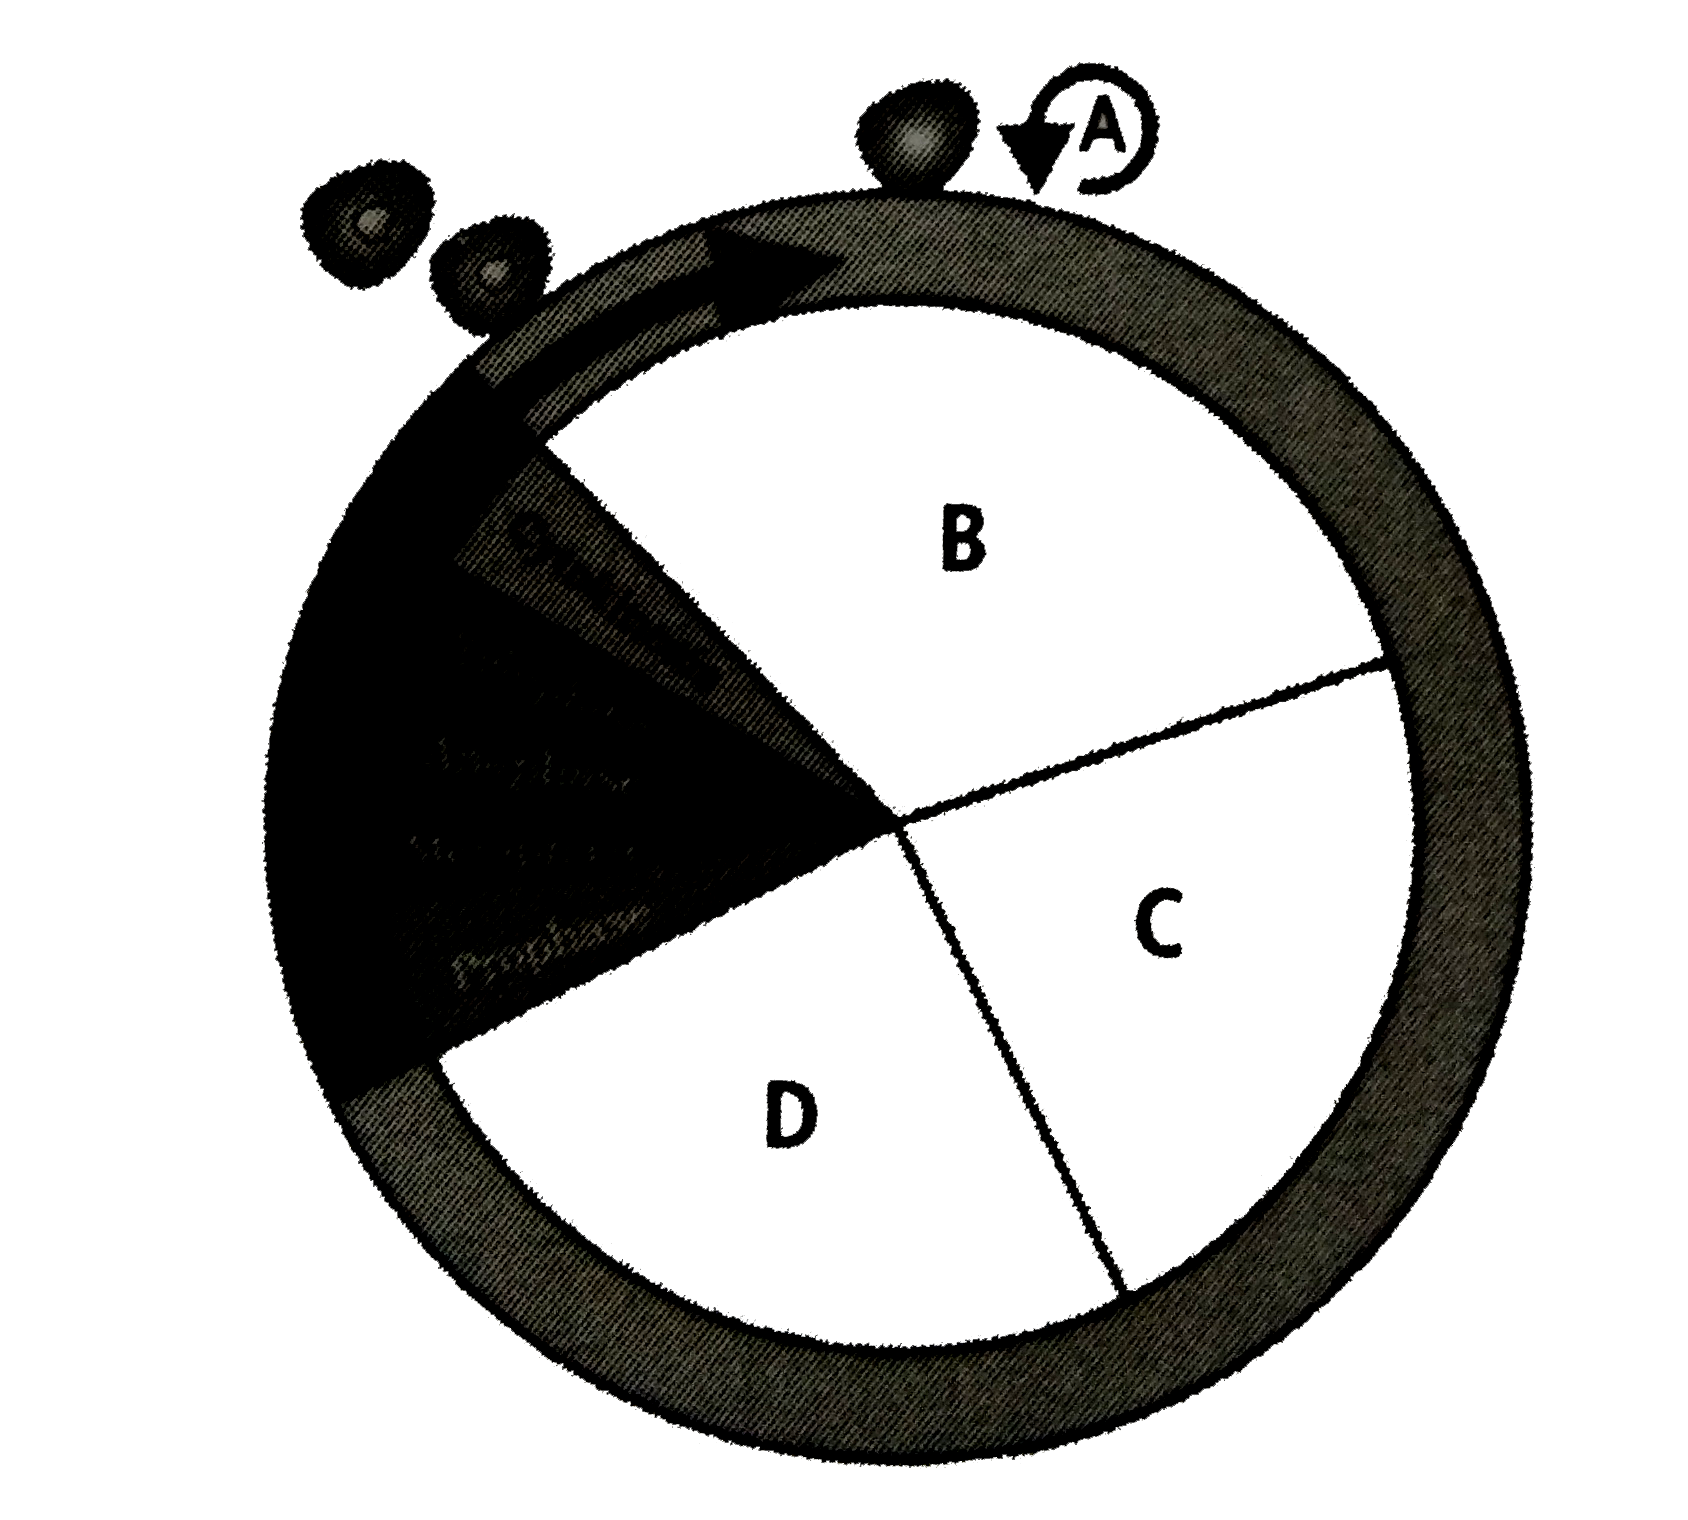
View SolutionIdentify the phase 'C' of the cell cycle given below.
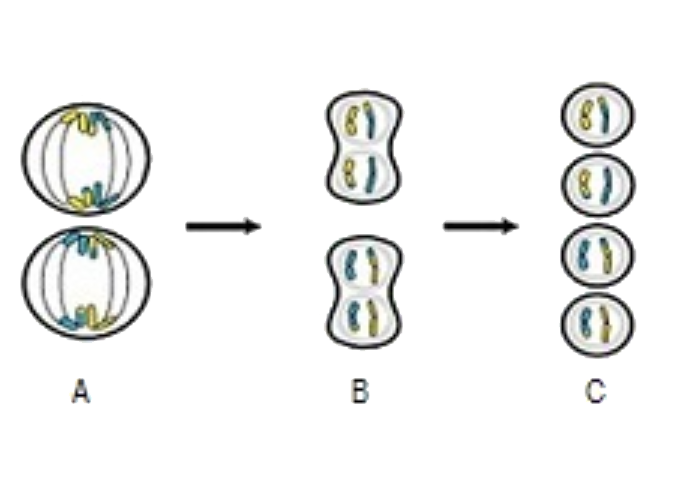
View SolutionRefer to the given graph showing hormone levels in the blood of an adult female during different phases of menstrual cycle.

Identify hormones P,Q,R and S and select the correct statement regarding them .
View Solution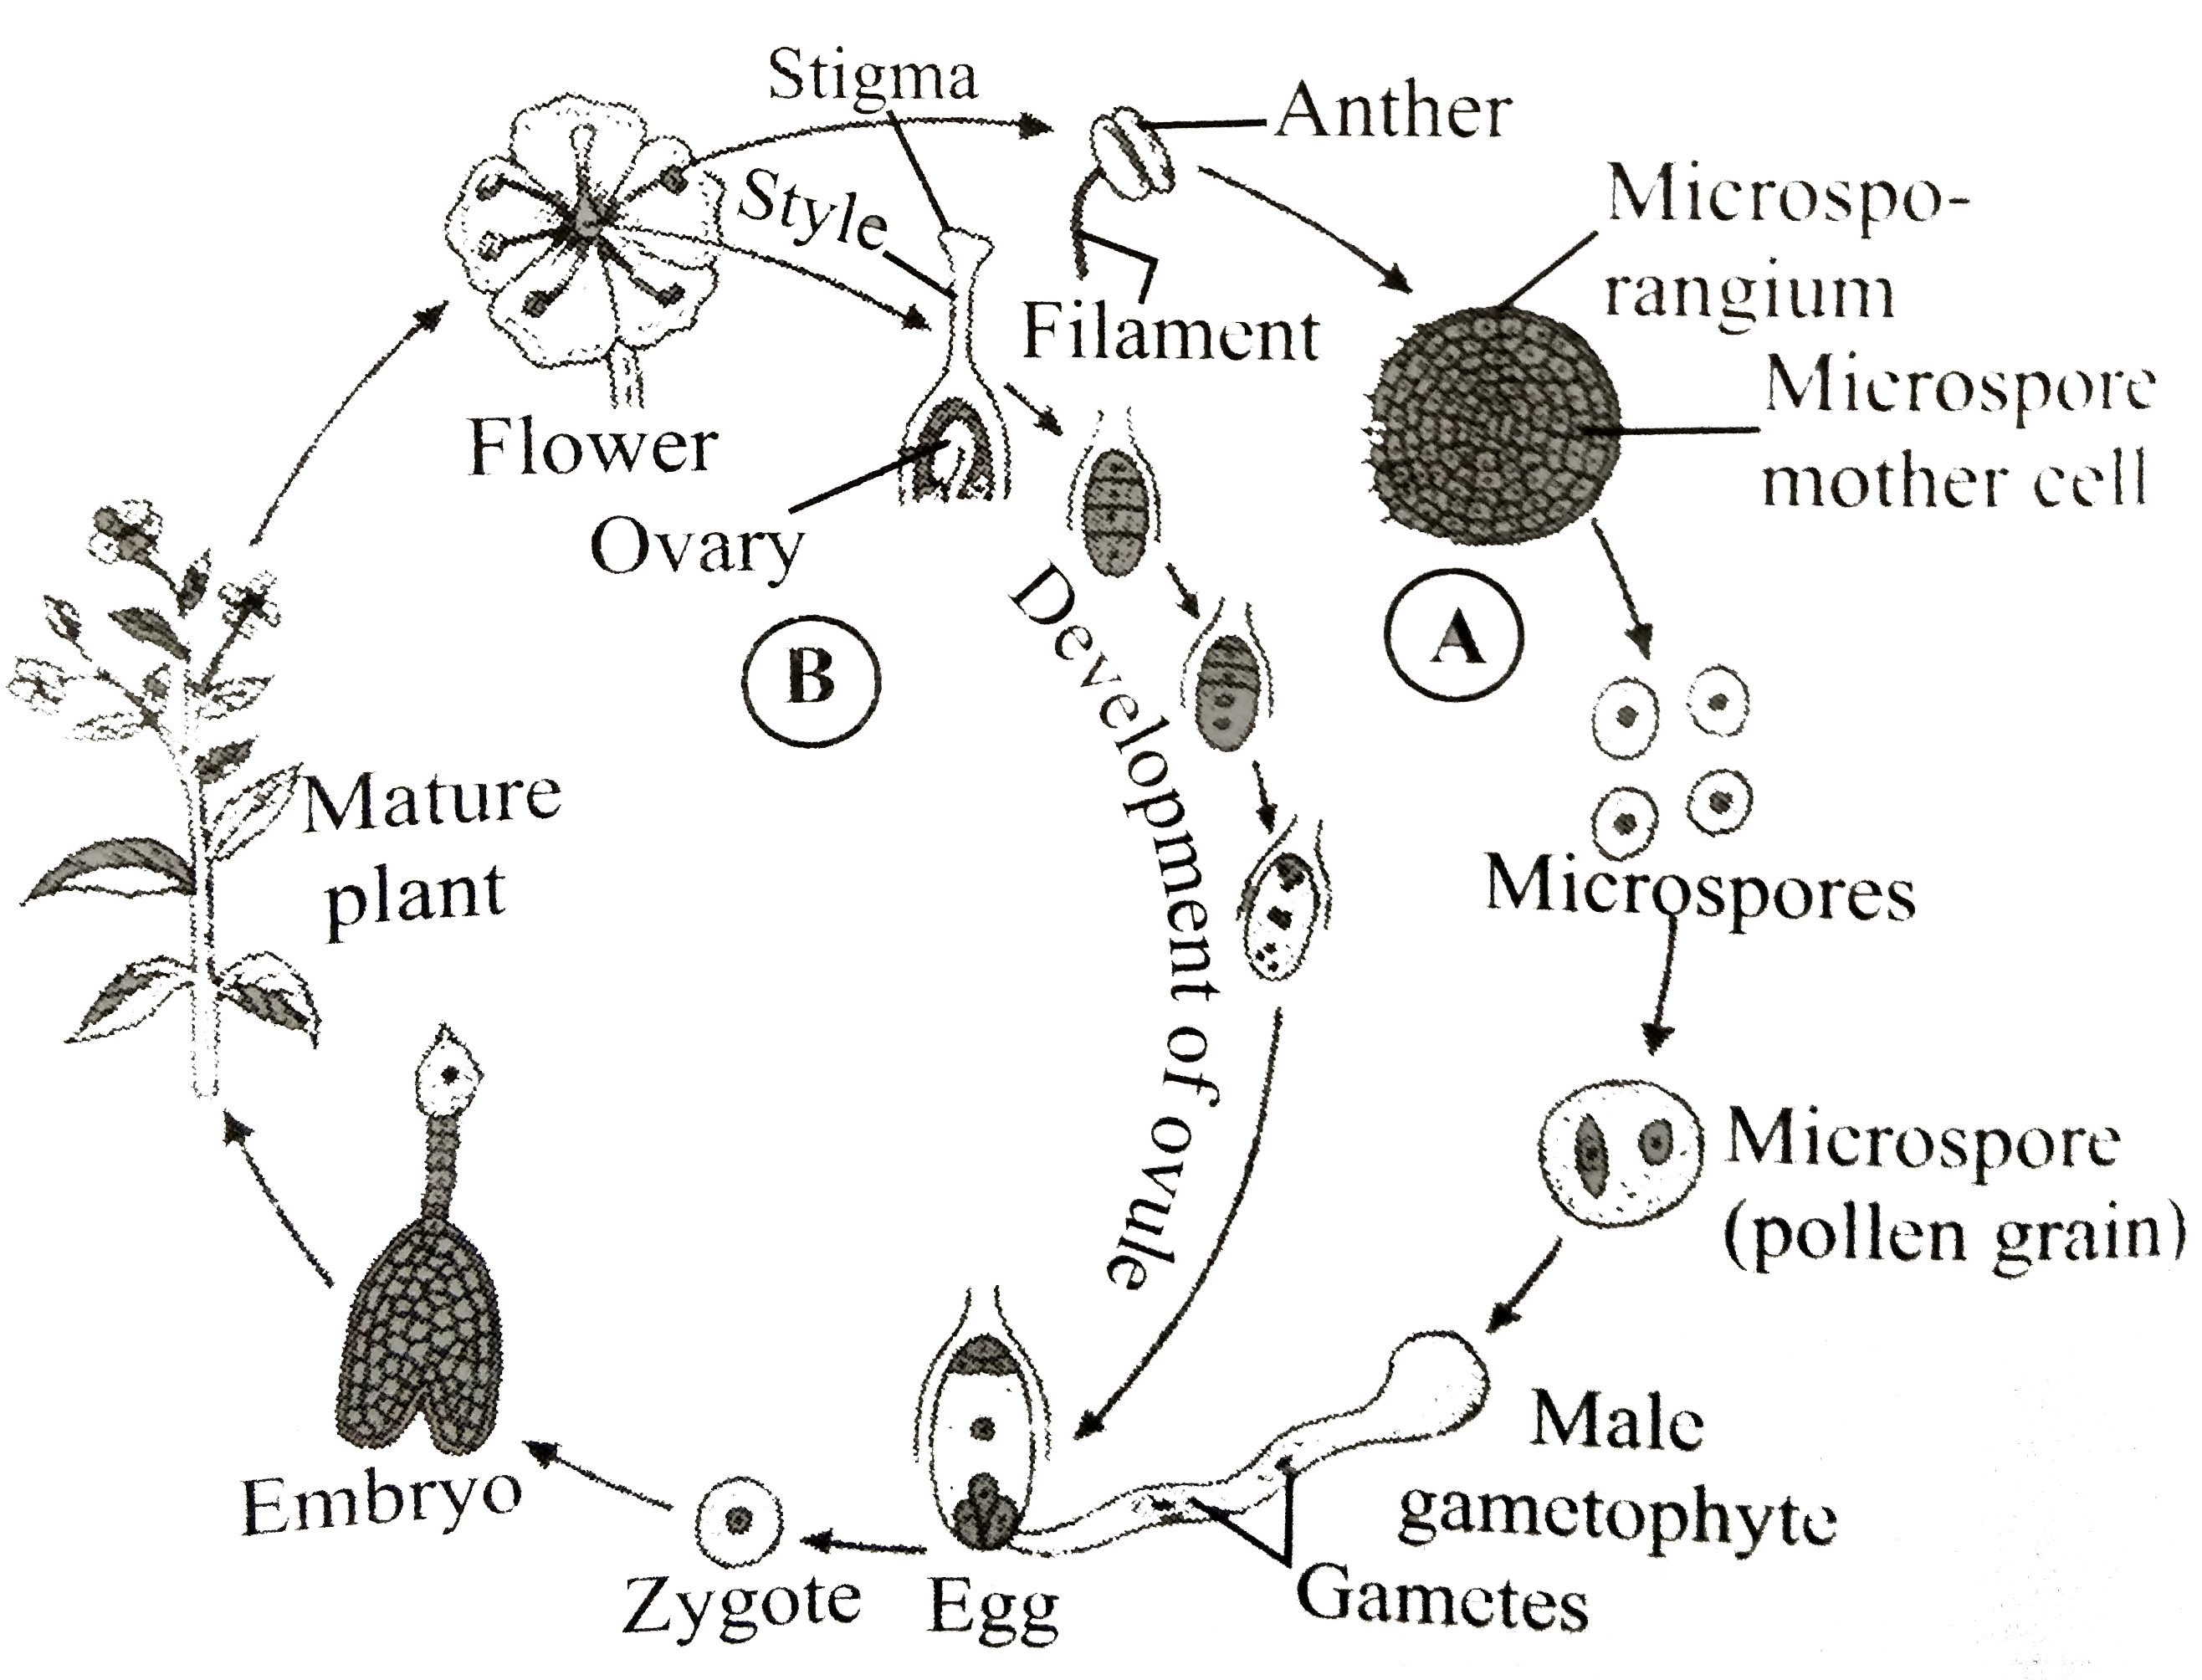
The given figure shows to phases, A and B of a typical angiospermic life cycle. Select the correct option regarding it.
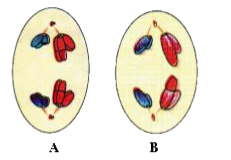
View SolutionGiven diagrams shows the phases of meiosis. Identify the phases :-
View Solution


