Study the following information carefully and answer the given questions.
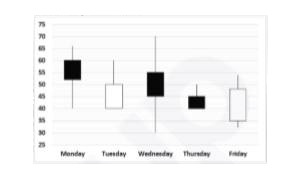
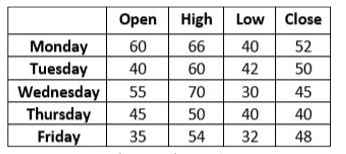
The following chart shows the opening, closing, high and low price of a share of a company XYZ on given 5 days-Monday, Tuesday, Wednesday, Thursday and Friday.
Opening and closing price of the shares of the company XYZ are represented by ceiling and floor of the black box and floor and ceiling of the white box respectively. The high and low price of the share of the company XYZ are represented by ceiling and floor of the line respectively
For example: On Monday, opening price = 60, closing price = 52, high price = 66 and low price = 40

Average closing price of shares of the company XYZ is what percent more than the average opening price for the given 5 days?

Average closing price of shares of the company XYZ for the given 5 days =52+50+45+40+485=47
Average opening price of shares of the company XYZ for the given 5 days =60+40+55+45+355=47
Hence, the required percentage =47−4747×100=%
Similar Questions
On Monday, the value of a company's shares was 7.50. The price increased by 6% on Tuesday, decreased by 1.5% on Wednesday, and decreased by 2% on Thursday Find the value of each share when trade opened on Friday.
View SolutionThe average temperature for Monday, Tuesday, Wednesday and Thursday was 48° . The average temperature for Tuesday, Wednesday, Thursday and Friday was 52°, If the temperature on Monday was 42°, then the temperature on Friday was (in degrees)
View SolutionThe average temperature of Monday, Tuesday , Wednesday and Thursday is 60°. The average temperature for Tuesday, Wednesday, Thursday and Friday is 63°. If the ratio of temperature for Monday and Friday is 21 : 25, then what is the temperature of Friday?
View SolutionThe following Bar chart shows the sales of a company XYZ (in Rs Crore). Study the chart and answer the following questions. Total sales in 2nd and 3rd years together is :
View SolutionThe following Bar chart shows the sales of a company XYZ (in Rs Crore). Study the chart and answer the following questions. The 2nd highest sale in the year :
View SolutionThe following Bar chart shows the sales of a company XYZ (in Rs Crore). Study the chart and answer the following questions. The 2nd least sale is in the year :
View SolutionThe following Bar chart shows the sales of a company XYZ (in Rs Crore). Study the chart and answer the following questions. The mean of the highest and the lowest sale (in Rs Crore) is :
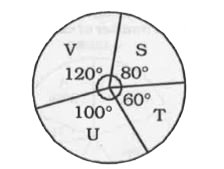
View SolutionThe following pie-chart shows the market share of four companies S, T, U and V. Total market is worth Rs. 72 crores. Study the pie-chart and answer the questions.

The company having maximum market share is
View Solution