निम्नलिखित तालिका का अध्ययन करें और दिए गए सवाल का जवाब दें
ये तालिका उन उम्मीदवारों की संख्या को दर्शाती है, जिन्होंने अलग-अलग वर्षों में अलग-अलग राज्यों से सरकारी परीक्षा उत्तीर्ण की थी।

2013 में आंध्र प्रदेश एवं बिहार से परीक्षा उत्तीर्ण करने वाले उम्मीदवारों की संख्या का औसत और 2016 में दिल्ली एवं उत्तर प्रदेश से परीक्षा उत्तीर्ण करने वाले उम्मेदवारों की संख्या के औसत का योग कितना है?
9190.5
9185.5
9180
9304
The correct Answer is:B
Step by step video, text & image solution for निम्नलिखित तालिका का अध्ययन करें और दिए गए सवाल का जवाब दें ये तालिका उन उम्मीदवारों की संख्या को दर्शाती है, जिन्होंने अलग-अलग वर्षों में अलग-अलग राज्यों से सरकारी परीक्षा उत्तीर्ण की थी। 2013 में आंध्र प्रदेश एवं बिहार से परीक्षा उत्तीर्ण करने वाले उम्मीदवारों की संख्या का औसत और 2016 में दिल्ली एवं उत्तर प्रदेश से परीक्षा उत्तीर्ण करने वाले उम्मेदवारों की संख्या के औसत का योग कितना है? by Maths experts to help you in doubts & scoring excellent marks in Class 14 exams.
Updated on:21/07/2023Similar Questions
The given table shows the number (in thousands) of cars of five different models A, B, C, D and E produced during Years 2012-2017. Study the table and answer the questions that follows: दी गयी तालिका पाँच अलग-अलग मॉडलों- A, B, C, D और E की कारों की संख्या ( हज़ार में ) दर्शाती है, जिनका उत्पादन वर्ष 2012-2017 के दौरान किया गया है | इस तालिका का अध्ययन करें और फिर पूछे गए प्रश्न का उत्तर दें | If 2013 and 2014 are put together, which type of cars constitute exactly 25% of the total number of cars produced in those two years? यदि 2013 और 2014 को मिला दिया जाए, तो इन दो वर्षों में उत्पादित कारों की कुल संख्या का ठीक 25% भाग किस प्रकार की कारों का है ?
View SolutionThe given table represents the production of different types of motorcycles (in thousands) over a period of six years. Study the table carefully and answer the questions that follows: दी गयी तालिका छः वर्षों की अवधि के दौरान अलग-अलग प्रकार की मोटर साइकिलों के उत्पादन ( हज़ार में ) को दर्शाती है | इस तालिका का ध्यानपूर्वक अध्ययन करें तथा फिर पूछे गए प्रश्नों का उत्तर दीजिए | What is the ratio of the total number of motorcycles of type B produced in 2016 and 2018 to the total number of motorcycles of type D produced in 2013, 2015 and 2016? 2016 तथा 2018 में उत्पादित की गयी B प्रकार की मोटरसाइकिलों की कुल संख्या का 2013, 2015 और 2016 में उत्पादिति D प्रकार की मोटरसाइकिलों की कुल संख्या के साथ अनुपात ज्ञात कीजिए |
View SolutionThe following table shows the number of students enrolled in different faculties in a college.
निम्नलिखित तालिका एक कॉलेज में अलग-अलग विषयों में नामांकित छात्रों की संख्या को दर्शाती है | The percentage of students studying in faculties other than Science is:
विज्ञान के अतिरिक्त अन्य विषयों की पढ़ाई करने वाले छात्रों का प्रतिशत है
View SolutionThe following table represents the number of candidates that appeared and qualified in a competitive examination from different states over five years. Study the table and answer the questions that follow. What is the average number of candidates that appeared from State Q during the given years?
निम्नलिखित तालिका उन उम्मीदवारों की संख्या को दर्शाती है जो पाँच वर्षों के दौरान विभिन्न राज्यों से किसी प्रतियोगी परीक्षा में शामिल हुए तथा सफल हुए | इस तालिका का अध्ययन कीजिए तथा फिर पूछे गए प्रश्नों के उत्तर दीजिए |
दिए गए वर्षों के दौरान राज्य Q से परीक्षा में शामिल होने वाले उम्मीदवारों की औसत संख्या कितनी है?
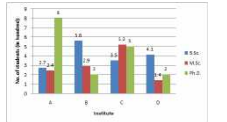
View SolutionThe following graph shows the number of students (in hundreds) in three different courses in four different institutes.Study the graph and answer the question. What is the total number of students (in hundreds) in M.Sc. course across all institutes?
निम्नलिखित आरेख चार अलग-अलग संस्थानों में तीन अलग-अलग पाठ्यक्रमों में छात्रों की संख्या , (सैकड़ों में) दिखाता है। आरेख का अध्ययन करें और प्रश्न का उत्तर दें।
सभी संस्थानों में M.Sc. पाठ्यक्रम में छात्रों की कुल संख्या (सो में ) कितनी है?
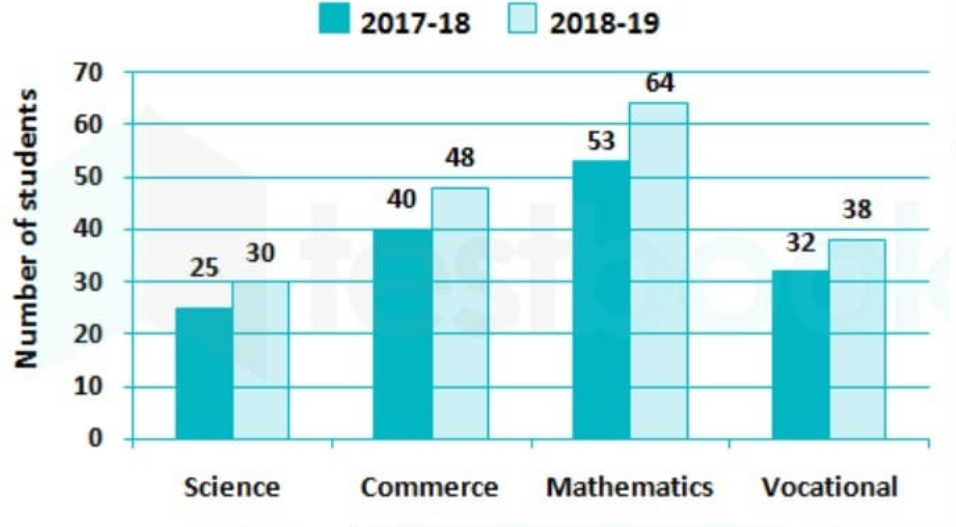
View SolutionThe given bar graph represents the number of students who appeared in the board examination in session 2017-18 and 2018-19. Study the graph and answer the question that follows. What is the ratio of the total number of students appeared in examinations in 2017-18 and 2018-19?
दिया गया दंड आरेख सत्र 2017-18 और 2018-19 सत्र में बोर्ड परीक्षा में उपस्थित होने वाले छात्रों की संख्या को दर्शाता है। आरेख का अध्ययन करें और प्रश्न का उत्तर दें।
2017-18 और 2018-19 में परीक्षा में उपस्थित हुए छात्रों की कुल संख्या का अनुपात कया है ?
View SolutionStudy the following histogram and answer the given question
निम्नलिखित आयत चित्र का अध्ययन करें और दिए गए प्रश्न का उत्तर दें।
What is the ratio of the number of students who scored 30 or more marks, but below 40 marks, to the total number of students in the entrance examination ?
प्रवेश परीक्षा में 30 या अधिक लेकिन 40 से कम अंक लाने वाले छात्रों की संख्या का प्रवेश परीक्षा में शामिल कुछ छात्रों की संख्या से क्या अनुपात है?
View SolutionIn an examination, the success to failure ratio was 5:2. Had the number of failures been 14 more, then the success to failure ratio would have been 9:5. The total number of candidates who appeared for the examination was: एक परीक्षा में, सफलता का असफलता से अनुपात 5:2 था| अगर असफलताओं की संख्या 11 अधिक थी, तो सफलता का असफलता से अनुपात 9:5 होता परीक्षा में बैठने वाले उम्मीदवारों की कुल संख्या थीः
View Solution
