The following Bar graph shows information of the results in the national level entrance exam by the institute ''ABC'' for the last 5 years.
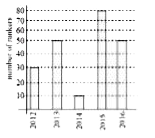
In the year 2015, how many ranks were scored from institute ''ABC'' ?
90
80
60
70
The correct Answer is:B
Step by step video, text & image solution for The following Bar graph shows information of the results in the national level entrance exam by the institute ''ABC'' for the last 5 years. In the year 2015, how many ranks were scored from institute ''ABC'' ? by Maths experts to help you in doubts & scoring excellent marks in Class 14 exams.
Updated on:21/07/2023Similar Questions
The following bar graph shows the number of students (in hundreds) who have opted for different courses A, B, C and D in 3 years in a college. Study the graph and answer the question.
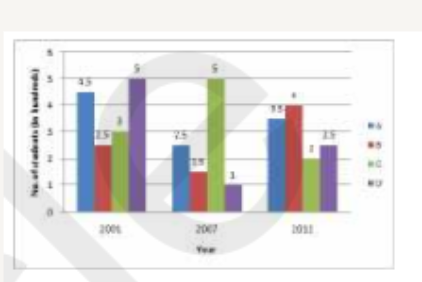 What is the ratio of the number of students who were admitted to course A in the year 2007 to that
of students who were admitted to course C in the year 2012?
View SolutionThe following graph below shows the number of students (in thousands) who were admitted to three different courses in 5 years in a university. Study the graph and answer the question.
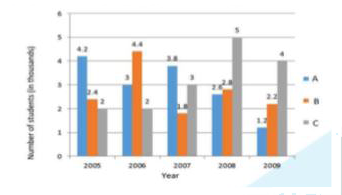
What is the ratio of the number of students who were admitted to course A in the year 2007 to that of students who were admitted to course C in the year 2009?
View Solution
Knowledge Check
The following bar graph shows information on the sales of the personal computers by the company ''XYZ'' for the last 10 years.
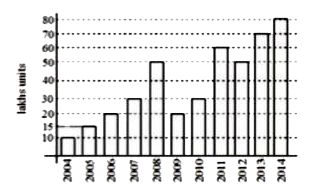
How many units (lakhs) of personal computers were sold by the company XYZ in 2009 ?
(a)15
(b)20
(c)10
(d)30A15B20C10D30The following bar graph shows infomiation on the sales of the personal computers by the company "XYZ" for the last 10 year?
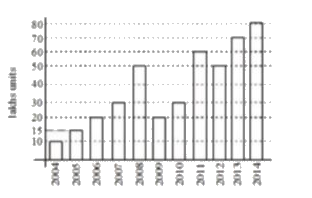
How many units of personal computers were sold by the company XYZ in 2011?
(a)60
(b)50
(c)80
(d)70A60B50C80D70The following chart shows the results of three athletic academies in the district level selections for three years.

How many selections were done in the year 2014 for academy 'C'?A19B9C7D3
The following bar graph shows the price per square feet ( in Rs. ) of lands in different years.
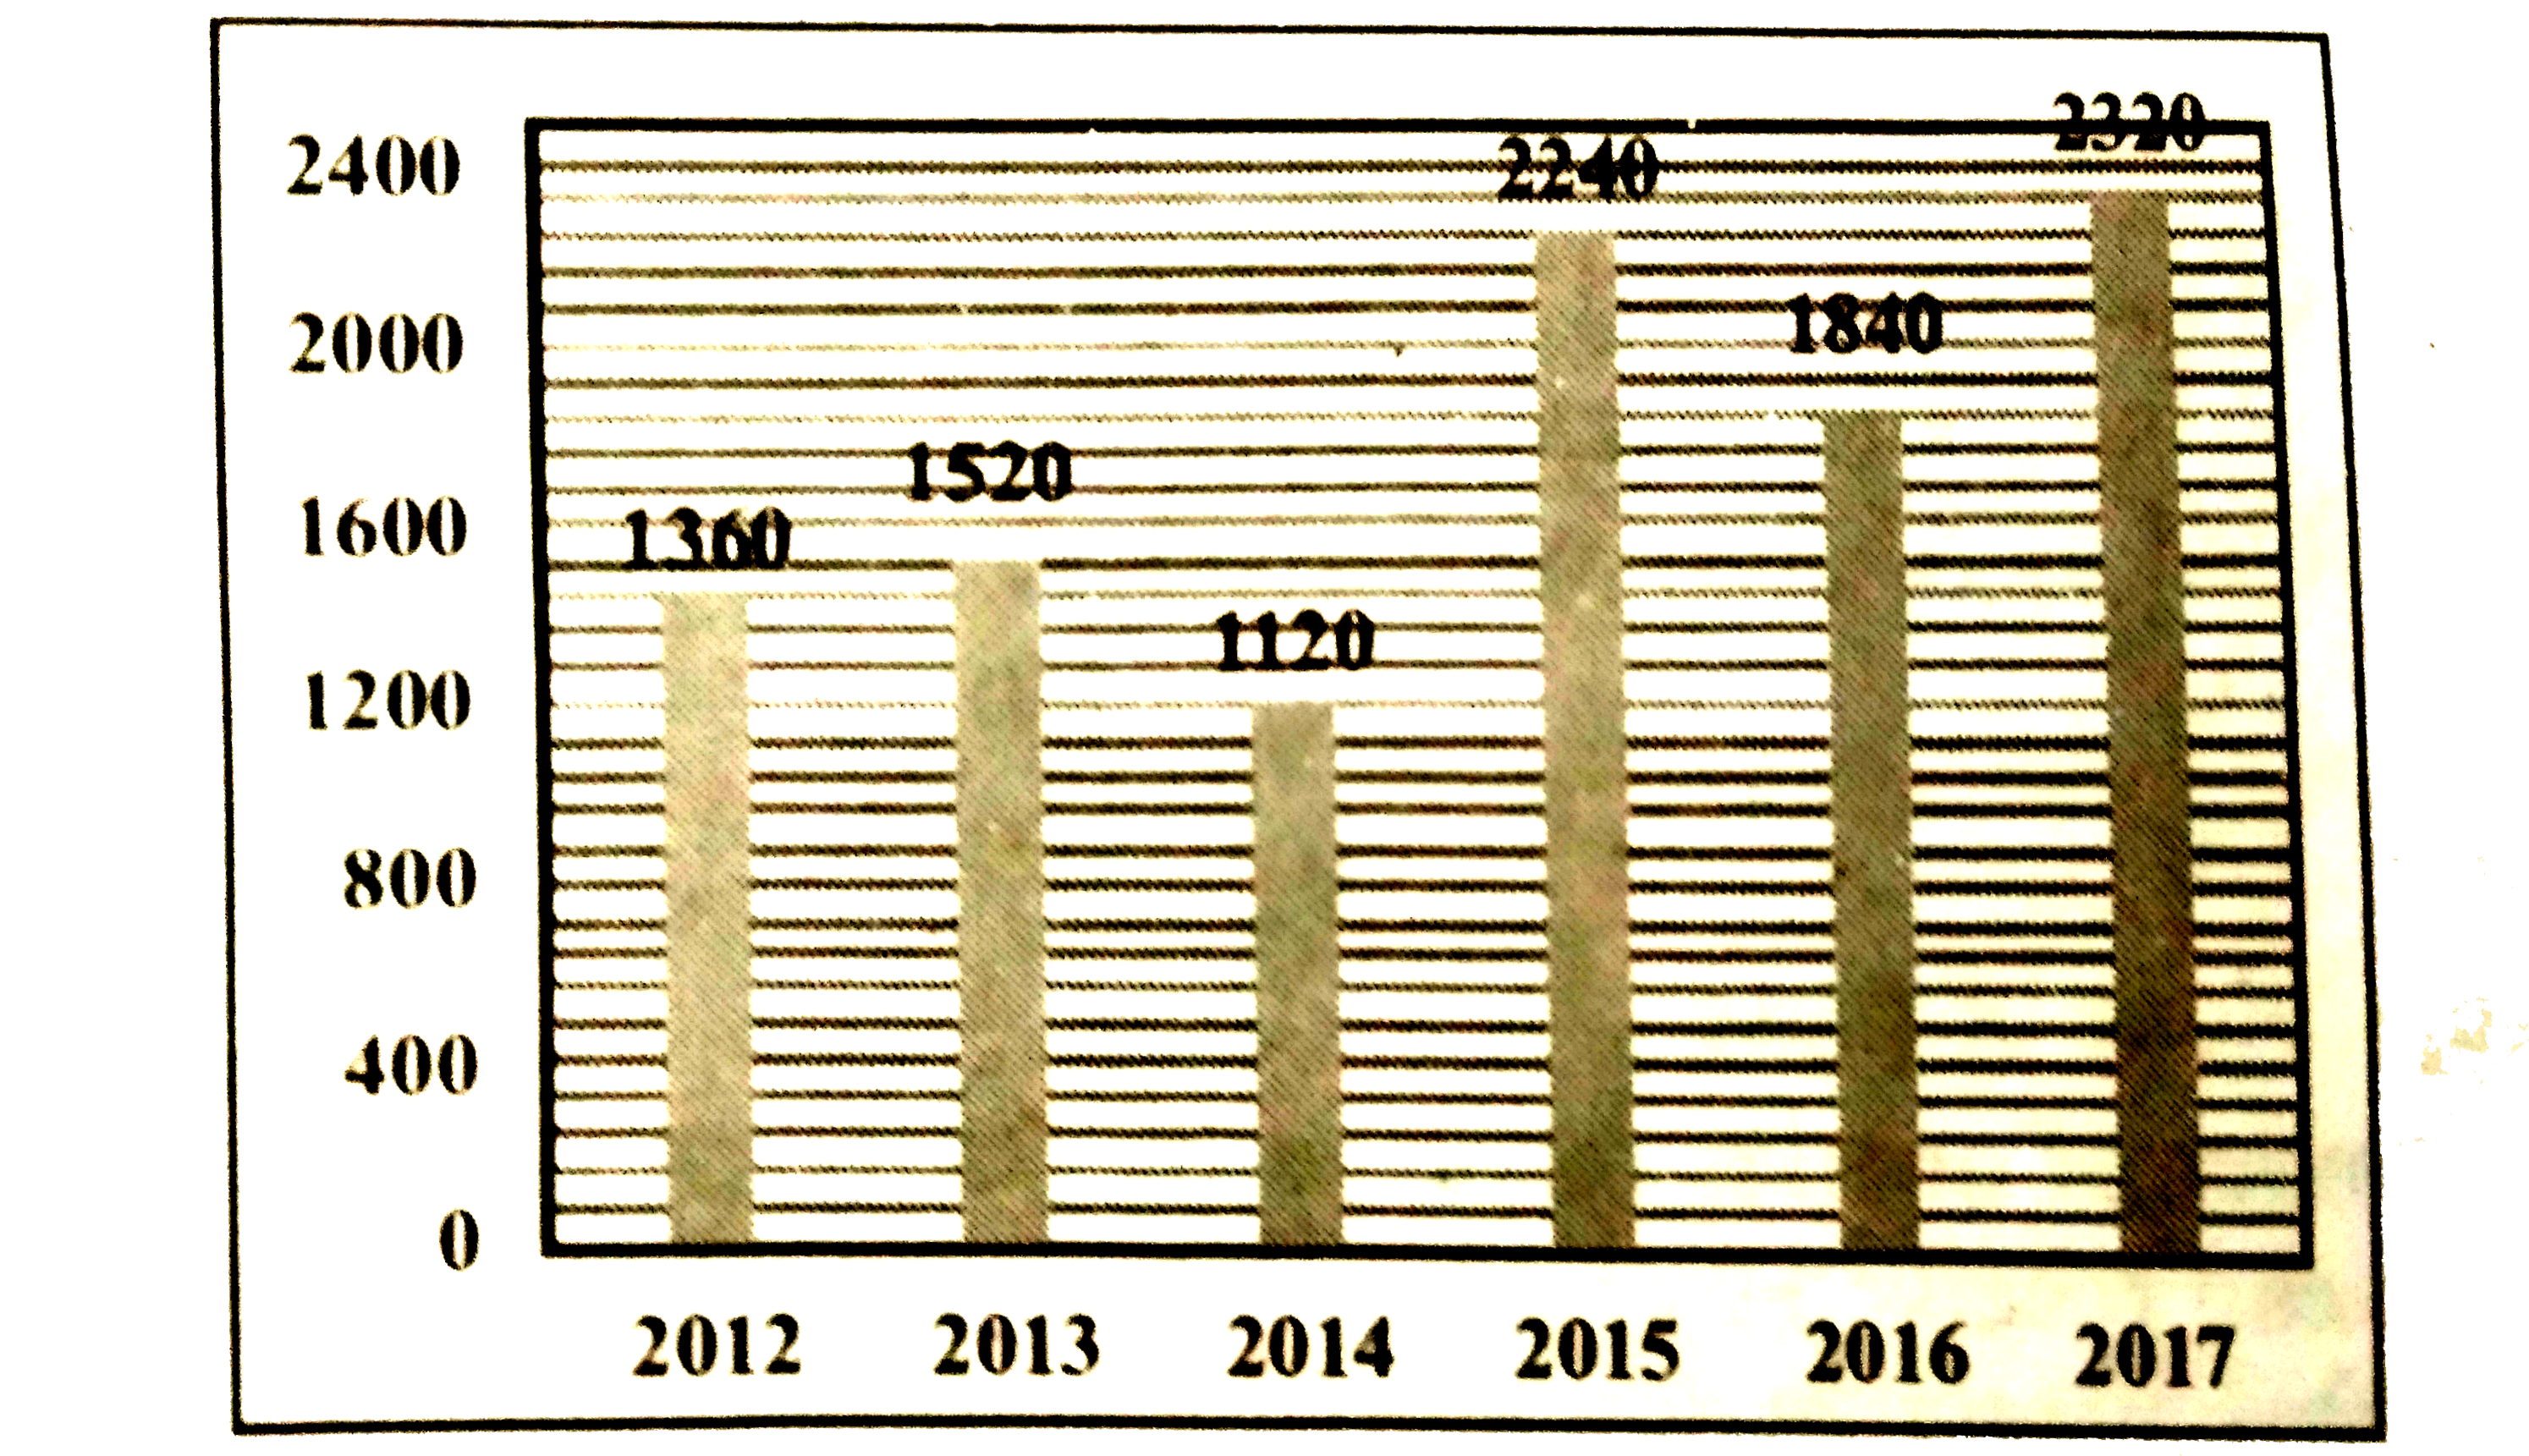
The price per square feet in the year 2012 and 2015 together is approximately what perentage of the price per square feet in the year 2013 and 2016 together?
View SolutionStudy the graph carefully and answer the question.
The following graph shows information about the pass percentage of SSC students from the village XYX for the last 10 years.
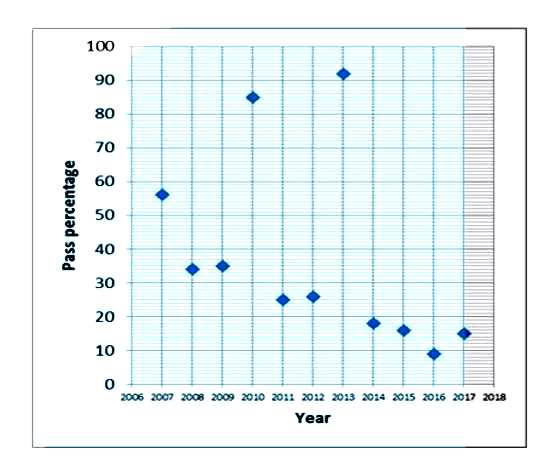
What is the pass percentage of SSC students from the village XYX in the year 2011 ?
View SolutionStudy the following table carefully and answer the following question
The following graph shows information about the pass percentage of SSC students from the village XYX for the last 10 years.
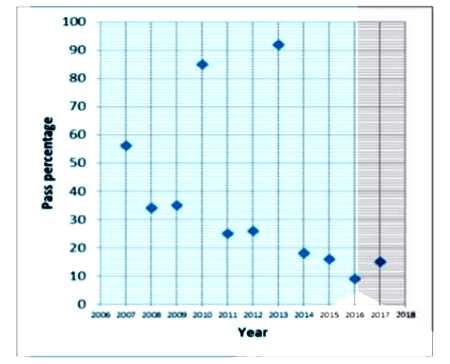
What is the pass percentage of SSC students from the village XYX in the year 2012 ?
View SolutionThe data shows the information on the number of children vaccinated in the year 2016 in different cities:
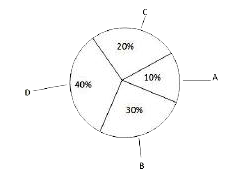
If the total number of children vaccinated in the year 2016 is 1,20,000, then how many kids from city 'B' were vaccinated?
View SolutionThe data shows the information on the number of children vaccinated in the year 2016 in different cities:
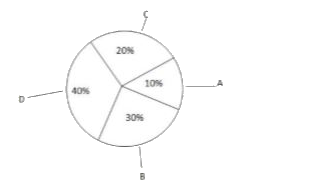
If the total number of children vaccinated in the year 2016 is 1,20,000, then how many children from city "'A' were vaccinated?
View Solution
