Study the following table carefully and answer the following question
The following graph shows information about the pass percentage of SSC students from the village XYX for the last 10 years.
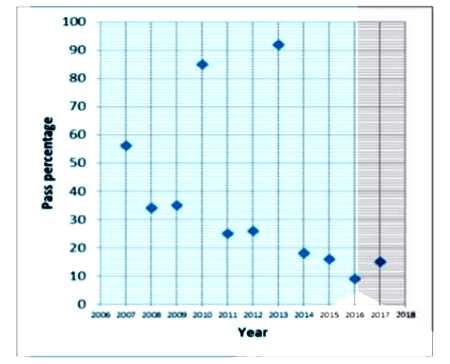
What is the pass percentage of SSC students from the village XYX in the year 2012 ?
96%
26%
59%
6%
The correct Answer is:B
Step by step video, text & image solution for Study the following table carefully and answer the following question The following graph shows information about the pass percentage of SSC students from the village XYX for the last 10 years. What is the pass percentage of SSC students from the village XYX in the year 2012 ? by Reasoning experts to help you in doubts & scoring excellent marks in Class 14 exams.
Updated on:21/07/2023Topper's Solved these Questions
- SSC PREVIOUS YEAR PAPER GRADUATION LEVEL (15 OCT 2019) BOOK - SSC SELECTION POSTCHAPTER - SSC PREVIOUS YEAR PAPER GRADUATION LEVEL (15 OCT 2019) EXERCISE - SECTION : GENERAL INTELLIGENCE
25 Videos
- SSC PREVIOUS YEAR PAPER HSC LEVEL (15 OCT 2019)BOOK - SSC SELECTION POSTCHAPTER - SSC PREVIOUS YEAR PAPER HSC LEVEL (15 OCT 2019)EXERCISE - Section : General Intelligence
25 Videos
Similar Questions
What is the approximate percentage of students passed during five academic years
View SolutionStudy the following table carefully and answer the questions given below :

In which institution, the percentage of students studying Commerce with respect to the total students of the institution maximum ?
View Solution
Knowledge Check
Study the graph carefully and answer the question.
The following graph shows information about the pass percentage of SSC students from the village XYX for the last 10 years.
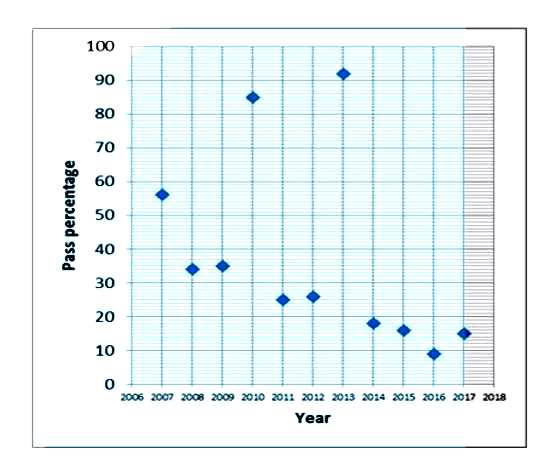
What is the pass percentage of SSC students from the village XYX in the year 2011 ?A98%B25%C18%D56%Study the following graph carefully and answer the following questions -----
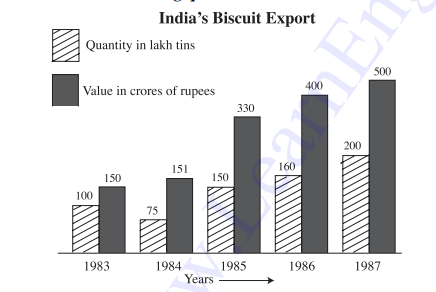
What was the percentage drop in export quantity from 1983 to 1984 ?A75BNilC25D50Study the following table carefully to answer these questions ---
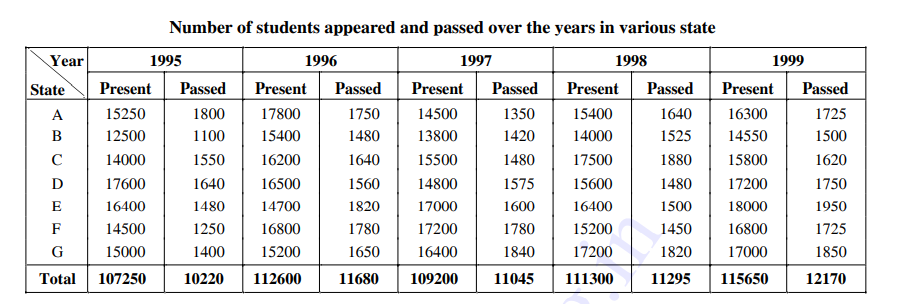
In which state the percentage of passed students to the appeared students in 1995 is the least ?AABFCBDD
Study the following graph carefully and answer the questions that
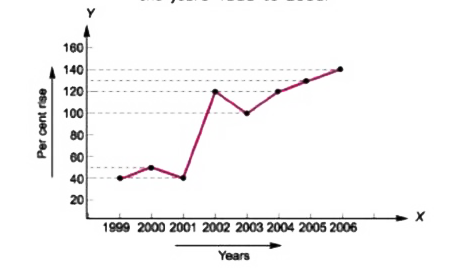
For how many years , the percent rise was more than 100 % ?
View SolutionStudy the following graph carefully and answer the questions that follow
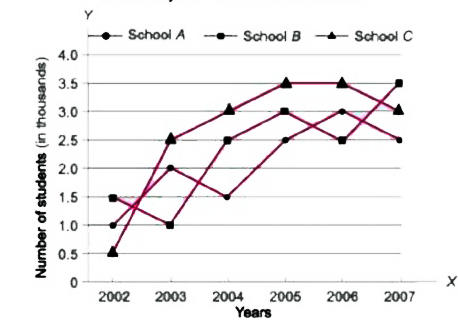
What was the approximate average number of students in school A over all the years together ?
View SolutionStudy the following table carefully and answer the questions given below :

Out of the total students of the institute D, approximately what percentage of students are studying Science ?
View SolutionStudy the following table carefully to answer these questions.
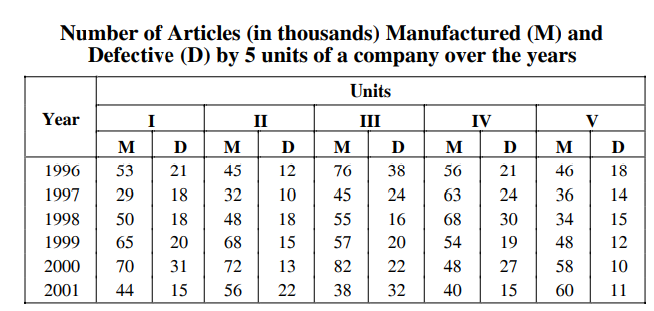
During which year was the percentage increase/decrease in manufacture from the previous year the highest for unit?
View SolutionStudy the following graph carefully and answer the questions given below it -----
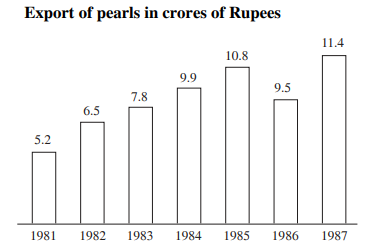
What was the percentage increase in export from 1986 to 1987 ?
View Solution
