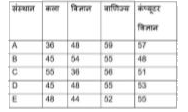
निम्नांकित तालिका का अध्ययन करें और उसके बाद दिए गए प्रश्न का उत्तर दें। तालिका में दिए गए आंकड़े पांच संस्थानों में चार भिन्न-भिन्न विषयों में अध्ययन करने वाले छात्रों की संख्या को दर्शाते हैं।

संस्थानों A और C में मिलाकर कंप्यूटर विज्ञान का अध्ययन करने वाले कुल छात्रों की संख्या संस्थानों B और D में कला का अध्ययन करने वाले छात्रों की संख्या की कितने प्रतिशत है?
83.3
200
108
120
The correct Answer is:D
Step by step video, text & image solution for निम्नांकित तालिका का अध्ययन करें और उसके बाद दिए गए प्रश्न का उत्तर दें। तालिका में दिए गए आंकड़े पांच संस्थानों में चार भिन्न-भिन्न विषयों में अध्ययन करने वाले छात्रों की संख्या को दर्शाते हैं। संस्थानों A और C में मिलाकर कंप्यूटर विज्ञान का अध्ययन करने वाले कुल छात्रों की संख्या संस्थानों B और D में कला का अध्ययन करने वाले छात्रों की संख्या की कितने प्रतिशत है? by Maths experts to help you in doubts & scoring excellent marks in Class 14 exams.
Updated on:21/07/2023Similar Questions
The Table shows the number of students from different schools playing different games. यह तालिका अलग-अलग विद्यालयों के छात्रों की संख्या को दर्शाती है जो अलग-अलग खेल खेलते हैं ? What is the ratio of the total students who play cricket in schools A and B together to the total students who play hockey in schools C and D ? विद्यालय A और B में क्रिकेट खेलने वाले छात्रों की कुल संख्या का विद्यालय C और D में हॉकी खेलने वाले छात्रों की कुल संख्या के साथ क्या अनुपात है ?
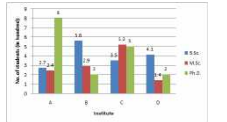
View SolutionThe following graph shows the number of students (in hundreds) in three different courses in four different institutes.Study the graph and answer the question. What is the total number of students (in hundreds) in M.Sc. course across all institutes?
निम्नलिखित आरेख चार अलग-अलग संस्थानों में तीन अलग-अलग पाठ्यक्रमों में छात्रों की संख्या , (सैकड़ों में) दिखाता है। आरेख का अध्ययन करें और प्रश्न का उत्तर दें।
सभी संस्थानों में M.Sc. पाठ्यक्रम में छात्रों की कुल संख्या (सो में ) कितनी है?
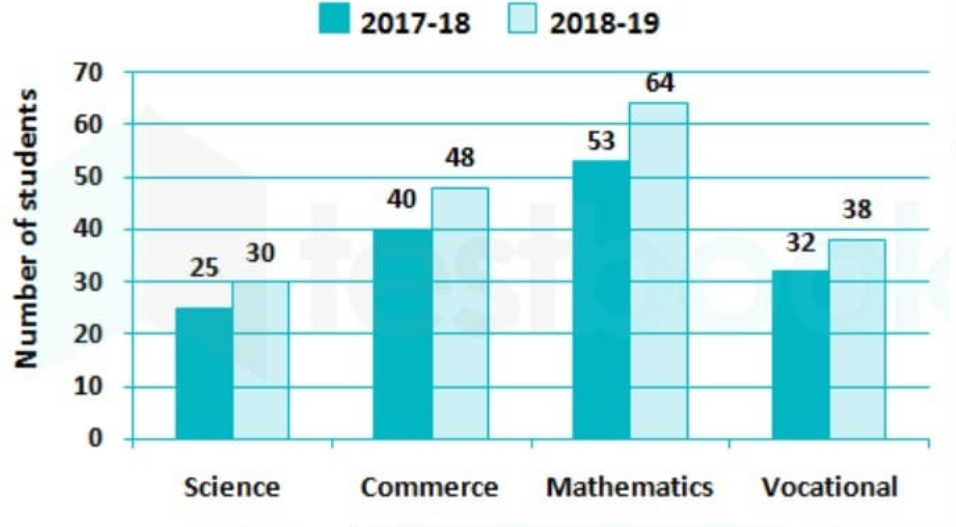
View SolutionThe given bar graph represents the number of students who appeared in the board examination in session 2017-18 and 2018-19. Study the graph and answer the question that follows.
दिया गया दंड आरेख सत्र 2017-18 और 2018-19 सत्र में बोर्ड परीक्षा में उपस्थित होने वाले छात्रों की संख्या को दर्शाता है। आरेख का अध्ययन करें और प्रश्न का उत्तर दें। The difference between the average number of students of Science and Humanities stream in 2017-18 and that in Commerce and Vocational in 2018-19 is:
2017-18 में विज्ञान और मानविकी विषय के छात्रों की औसत संख्या और 2018-19 में वाणिज्य और व्यावसायिक में छात्रों की औसत संख्या के बीच अंतर ज्ञात करे।
View SolutionThe given bar graph represents the number of students who appeared in the board examination in session 2017-18 and 2018-19. Study the graph and answer the question that follows. What is the ratio of the total number of students appeared in examinations in 2017-18 and 2018-19?
दिया गया दंड आरेख सत्र 2017-18 और 2018-19 सत्र में बोर्ड परीक्षा में उपस्थित होने वाले छात्रों की संख्या को दर्शाता है। आरेख का अध्ययन करें और प्रश्न का उत्तर दें।
2017-18 और 2018-19 में परीक्षा में उपस्थित हुए छात्रों की कुल संख्या का अनुपात कया है ?
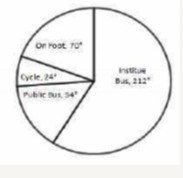
View SolutionStudy the pie-chart and answer the questions. In an institute, there are 900 students who use different modes of transport for to and from travel. The given pie diagram represents the requisite data.
पाई-चार्ट का अध्ययन करें और प्रश्नों के उत्तर दें। एक संस्थान में, 900 छात्र हैं जो आने-जाने के लिए परिवहन के विभिन्न साधनों का उपयोग करते हैं। दिए गए पाई चार्ट में संबंधित आंकड़े दिए गए हैं। The number of students who travel on foot is:
पैदल यात्रा करने वाले छात्रों की संख्या है:
View SolutionStudy the pie chart and answer the question that follows
आरेख का अध्ययन करें और प्रश्न का उत्तर दे।
Break up (degree wise) of students in terms of specialization in different areas (A,B,C,D&E) in MBA program.
MBA कार्यक्रम में विभिन्न क्षेत्रों (A, B, C, D और E) में विशेषज्ञता के संदर्भ में छात्रों का वितरण
The number of students specialising in E is what percent more than that of students specialising in C?
E में विशेषज्ञता प्राप्त छात्रों की संख्या, C में विशेषज्ञता प्राप्त छात्रों की संख्या की तुलना में कितना प्रतिशत अधिक है?
View SolutionStudy the following histogram and answer the given question
निम्नलिखित आयत चित्र का अध्ययन करें और दिए गए प्रश्न का उत्तर दें।
What is the ratio of the number of students who scored 30 or more marks, but below 40 marks, to the total number of students in the entrance examination ?
प्रवेश परीक्षा में 30 या अधिक लेकिन 40 से कम अंक लाने वाले छात्रों की संख्या का प्रवेश परीक्षा में शामिल कुछ छात्रों की संख्या से क्या अनुपात है?
View SolutionThe given pie chart shows the percentage distribution of 450 employees in an organization. Study the pie chart and answer the questions that follow
दिए गए पाई चार्ट एक संगठन में 450 कर्मचारियों के प्रतिशत को दर्शाता है। पाई चार्ट का अध्ययन करें और आने वाले प्रश्नों का उत्तर दें।
What is the central angle of the sector representing the number of employees in department A?
विभाग A में कर्मचारियों की संख्या का प्रतिनिधित्व करने वाले क्षेत्र का केंद्रीय कोण क्या है?
View Solution
