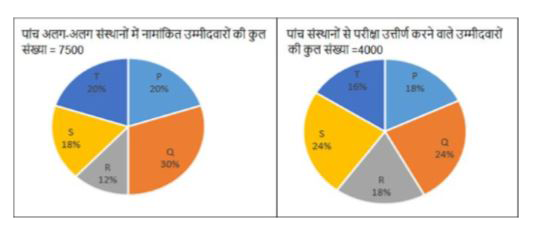
निम्न पाई आरेख, पांच अलग-अलग संस्थानों P, Q, R, S और T से किसी प्रतियोगी परीक्षा के लिए नामांकित उम्मीदवारों और (नामांकित में से) परीक्षा उत्तीर्ण करने वाले उम्मीदवारों के वितरण को निरूपित करता है।

संस्थानों Q, R और S में नामांकित उम्मीदवारों की कुल संख्या और संस्थानों Q, R और S से उत्तीर्ण उम्मीदवारों की कुल संख्या का अनुपात ज्ञात करें।
75:44
15:71
44:75
71:15
The correct Answer is:A
Step by step video, text & image solution for निम्न पाई आरेख, पांच अलग-अलग संस्थानों P, Q, R, S और T से किसी प्रतियोगी परीक्षा के लिए नामांकित उम्मीदवारों और (नामांकित में से) परीक्षा उत्तीर्ण करने वाले उम्मीदवारों के वितरण को निरूपित करता है। संस्थानों Q, R और S में नामांकित उम्मीदवारों की कुल संख्या और संस्थानों Q, R और S से उत्तीर्ण उम्मीदवारों की कुल संख्या का अनुपात ज्ञात करें। by Maths experts to help you in doubts & scoring excellent marks in Class 14 exams.
Updated on:21/07/2023Similar Questions
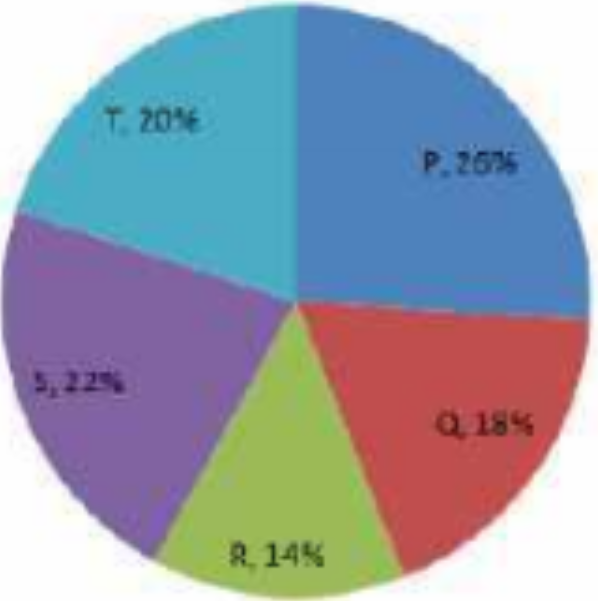
The following pie chart shows the percentage-wise distribution of the number of students in five different schools P, Q, R, S and T. The total number of students in all five schools together is 8400.
निम्नलिखित पाई चार्ट पांच अलग-अलग स्कूलों P, Q, R, S और T में छात्रों की संख्या के प्रतिशत को दर्शाता है। सभी पाँच स्कूलों में कुल छात्रों की संख्या 8400 है Find the average number of students in schools R and S together.
स्कूलों R और S में एक साथ छात्रों की औसत संख्या ज्ञात कीजिए।
View SolutionThe given bar graph represents the number of students who appeared in the board examination in session 2017-18 and 2018-19. Study the graph and answer the question that follows. What is the ratio of the total number of students appeared in examinations in 2017-18 and 2018-19?
दिया गया दंड आरेख सत्र 2017-18 और 2018-19 सत्र में बोर्ड परीक्षा में उपस्थित होने वाले छात्रों की संख्या को दर्शाता है। आरेख का अध्ययन करें और प्रश्न का उत्तर दें।
2017-18 और 2018-19 में परीक्षा में उपस्थित हुए छात्रों की कुल संख्या का अनुपात कया है ?
View SolutionIn an examination, the success to failure ratio was 5:2. Had the number of failures been 14 more, then the success to failure ratio would have been 9:5. The total number of candidates who appeared for the examination was: एक परीक्षा में, सफलता का असफलता से अनुपात 5:2 था| अगर असफलताओं की संख्या 11 अधिक थी, तो सफलता का असफलता से अनुपात 9:5 होता परीक्षा में बैठने वाले उम्मीदवारों की कुल संख्या थीः
View SolutionRs. 2100 is divided among in P , Q and R in such a way that P’s share is half of the combined share of Q and R , and Q’s share is one-fourth of the combined share of P and R. By what amount is R’s share more than that of P? 2100 को P, Q और R में इस तरह से विभाजित किया गया है कि P का हिस्सा Q और R के संयुक्त हिस्से का आधा है और Q का हिस्सा P और R के संयुक्त हिस्से का एक-चौथाई हिस्सा है। R की हिस्सेदारी P की हिस्सेदारी से कितना अधिक है?
View SolutionThere are five boys P, Q, R, S and T standing in a line. Q is taller than T but shorter than P. S is shorter that T but taller than R. Who is shortest? पांच लड़के P, Q, R, S और T एक कतार में खड़े हैं। Q कद में T से लम्बा है। किन्तु P से छोटा है। S, T से छोटा है किन्तु R से लम्बा है। सबसे छोटा कौन है?
View Solutionक्रोमते और डिक्रोमते अयानो में क्रोमियम और ऑक्सीजन परमणुओ के बिच सिग्मा बन्दों की कुल संख्या का योगफल है
View Solutionजब AX और BX2 के जलीय विलयन के माध्यम से विद्युत् के कूलॉम की बराबर संख्या प्रवाहित की जाती है और यदि A और B के निक्षेपित मोलों की संख्या क्रमशः Y और Z है तब-
View Solutionनिम्नलिखित में से किस प्रजाति में σ और π बंधों की संख्या समान होती है?
View Solution
