Study the given table and answer the following question:
Year Annual consumption (in bundred tonnes) of tea in five states (A, B, C, D and E) across 6 vears (2014 to 2019):
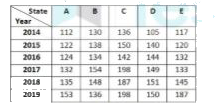
The consumption of tea in which state and year is closest to 1.1 times the average consumption of tea in state E over 6 years?
(a)D in 2018
(b)B in 2017
(c)C in 2015
(d)A in 2019
D in 2018
C in 2015
B in 2017
A in 2019
The correct Answer is:D
Step by step video & text solution for Study the given table and answer the following question: Year Annual consumption (in bundred tonnes) of tea in five states (A, B, C, D and E) across 6 vears (2014 to 2019): The consumption of tea in which state and year is closest to 1.1 times the average consumption of tea in state E over 6 years? (a)D in 2018 (b)B in 2017 (c)C in 2015 (d)A in 2019 by Maths experts to help you in doubts & scoring excellent marks in Class 14 exams.
Updated on:21/07/2023Topper's Solved these Questions
- SSC SELECTION POST 10 NOV 2020 SHIFT 2 HSC LEVELBOOK - SSC SELECTION POSTCHAPTER - SSC SELECTION POST 10 NOV 2020 SHIFT 2 HSC LEVELEXERCISE - QUANTITATIVE APTITUDE
25 Videos
- SSC SELECTION POST 14 DEC 2020 SHIFT 3 GRADUATION POST BOOK - SSC SELECTION POSTCHAPTER - SSC SELECTION POST 14 DEC 2020 SHIFT 3 GRADUATION POST EXERCISE - QUANTITATIVE APTITUDE
25 Videos
Similar Questions
Study the graph and answer the question
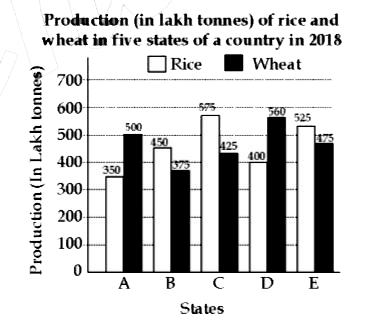
the ratio of the total production of rice in states C and E to the total production of wheat in states B and D is……..
View SolutionThe Constitution of India divided the states of India in categories A, B, C and D in the year 1950. In this context which of the following statements is correct?
View Solution
Knowledge Check
Study the given table and answer the following question:
Annual consumption (in hundred tonnes) of tea in five states (A, B, C, D and E) across 6 years (2014 to 2019):

The total consumption of tea in state C in 2015 to 2017 is by what percentage more than the total consumption of tea in states A, B and D in 2015?A18.4%B22.5%C20.6%D23.8%Study the following table and answer the questions based on it. What is the average population of state B (in lakh) for all the years together?
A25.24B24.44C24.24D25.44Study the bar graph and answer the question.
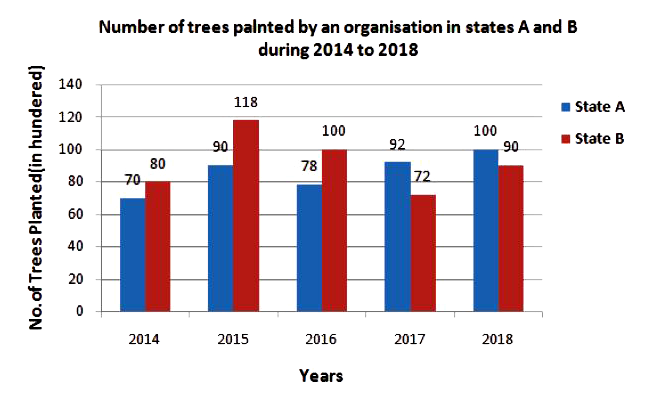
In how many years was the number of trees planted in state B more than the average number of trees planted in state A over the years ?Aa)1Bb)3Cc)4Dd)2
Study the bar graph and answer the question
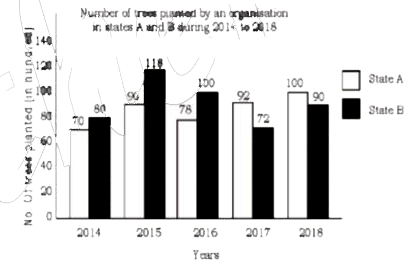
In how many years was the number of trees planted in state B more than the average number of trees planted in state A over the years
View SolutionWhat is the average production of Company B (in tonnes) from the year 2006 to the year 2011? (a) 574 (b) 649 (c) 675 (d) 593 (e) 618
View SolutionThe following graph shows the production of cotton bales of 100 kg each (in lakhs) by different states A, B, C, D and E over the years. Study the graph and answer the following Questions.
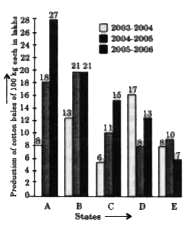
In which State(s) is there a steady increase in the production of cotton during the given period ?
View SolutionThe following graph shows the production of cotton bales of 100 kg each in lakhs by different states A, B, C, D and E over the years. Study the graph and answer the following Questions.
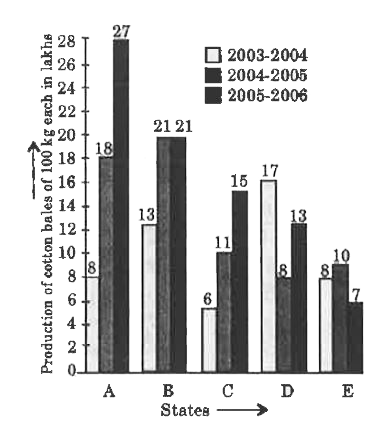
In which State(s) is there a steady increase in the production of cotton during the given period ?
View SolutionStudy the table carefully to answer the following questions ----
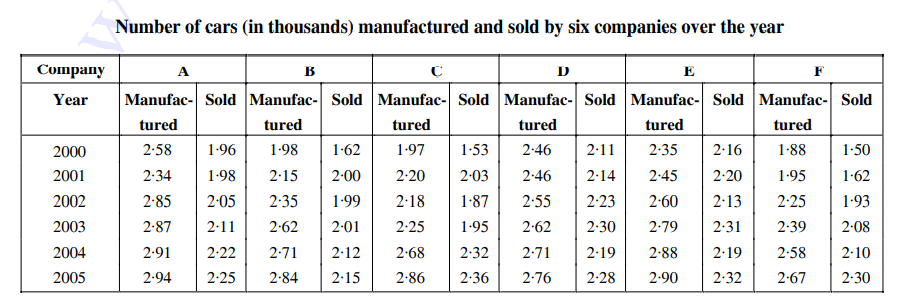
What is respective ratio of total number of cars manufactured by companies A, B and C together in the year 2001 to those manufactured by companies D, E and F together in the year 2003 ?
View Solution
