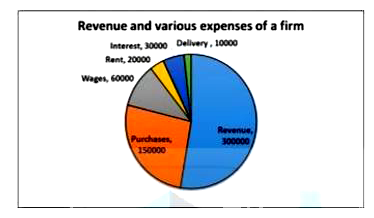
The Pie chart given below presents the projected revenue and various expenses for a firm for the previous financial year.
If the profit margin for the upcoming financial year is projected at 20%, then by how much percentage will the margin change according to the projections?
50% decrease
50% increase
100% increase
75% increase
The correct Answer is:C
Step by step video & text solution for The Pie chart given below presents the projected revenue and various expenses for a firm for the previous financial year. If the profit margin for the upcoming financial year is projected at 20%, then by how much percentage will the margin change according to the projections? by Maths experts to help you in doubts & scoring excellent marks in Class 14 exams.
Updated on:21/07/2023Similar Questions
The pie chart given below shows the expenditure on various items and savings of a family during the year 2009. Study the pie chart and answer these questions.
 The percentage of the income which was spent on clothing, education of children and transport together is-
View SolutionThe line chart given below shows the profit (in crores) of a company for the years 2008 to 2015.
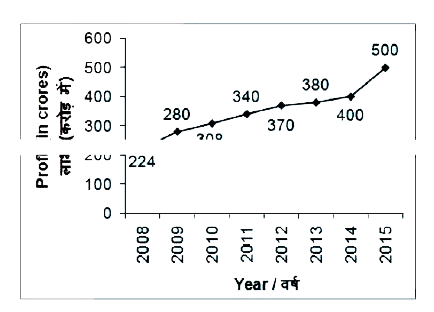
What is the percentage increase in profit in the year 2010 in comparison to the previous year ?
View Solution
Knowledge Check
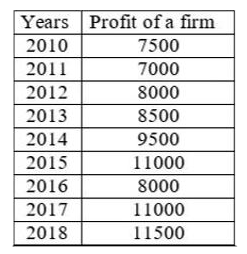
The Table given below presents the profit (in multiple of thousand rupees) of a firm for the years 2010-2018. By how much percentage is the average profit of years 2015-2017 greater than the profit of 2012?
 A50B12.5C25D33.33
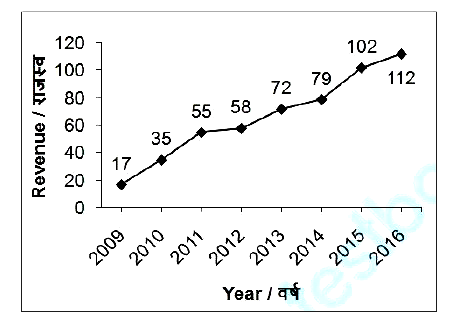
The line chart given below shows the revenue of a company (in lac rupees) from year 2009 to 2016
In how many years from 2010 to 2016 the increase in the revenue is more than 20% of the previous year value?A3B4C5D6The bar graph given below represents the revenue of a firm for 8 years. All the revenue figures have been shown in terms of Rs. crores.
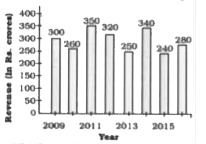
In which year the firm has shown maximum percentage with respect to the previous year ?Aa)2011Bb)2014Cc)2016Dd)All are equal
The line chart given below shows the revenue of a company (in lac rupees) from year 2009 to 2016.
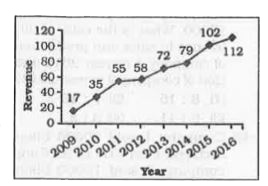
In how many years from 2010 to 2016 the increase in the revenue is more than 20% of the previous year value?
View SolutionThe bar chart given below shows the revenue (in crores) of company A for the years 2008 to 2015.
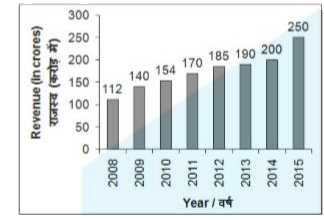
What is the percentage increase in revenue in the year 2010 in comparison to the previous year?
View SolutionThe given bar graph presents the Imports and Exports of an item manufactured by a company for the five financial years, 2013-2014 to 2017-2018.
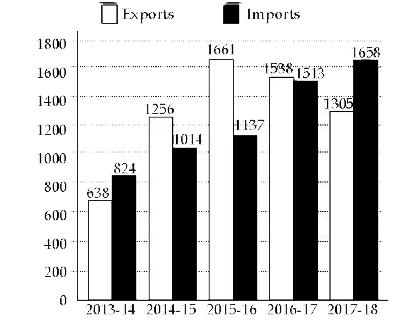
In which financial year the percentage increase in total of Exports and Imports is the highest in comparison to its previous financial year?
View SolutionThe line chart given below shows the profit (in crores) of a company for the years 2008 to 2015.
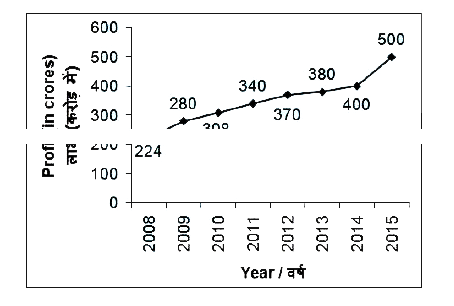
In how many years from 2009 to 2015 the increase in profit with respect to previous years is more than 30 crores?
View SolutionThe line chart given below shows the sales (in crores) of a company for the years 2009 to 2016
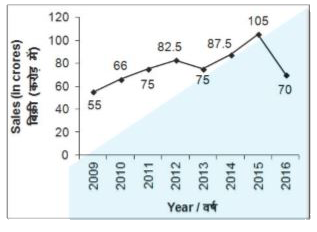
What is the percentage change in the company sales from year 2014 to year 2016?
View Solution
