The bar chart given below shows the revenue (in crores) of company A for the years 2008 to 2015.
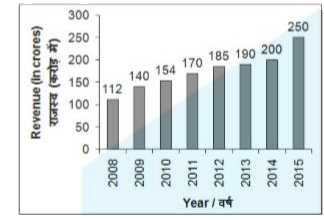
What is the percentage increase in revenue in the year 2010 in comparison to the previous year?
a)10
b)12
c)20
d)25
The correct Answer is:A
Step by step video, text & image solution for The bar chart given below shows the revenue (in crores) of company A for the years 2008 to 2015. What is the percentage increase in revenue in the year 2010 in comparison to the previous year? by Maths experts to help you in doubts & scoring excellent marks in Class 14 exams.
Updated on:21/07/2023Similar Questions
The bar chart given below shows the sales (in crores ) of company P from years 2009 to 2015 .
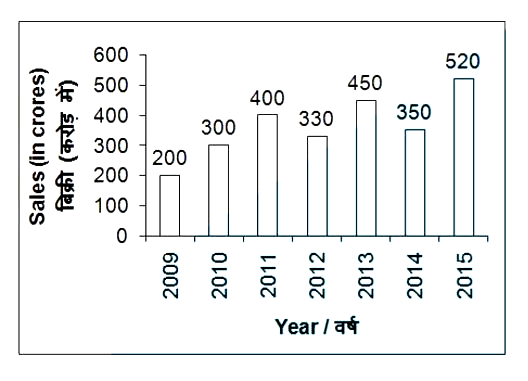
What is the percentage change in the sale from year 2009 to 2013?
View SolutionThe bar chart given below shows the sales ( in crores) of company P from years 2009 to 2015.
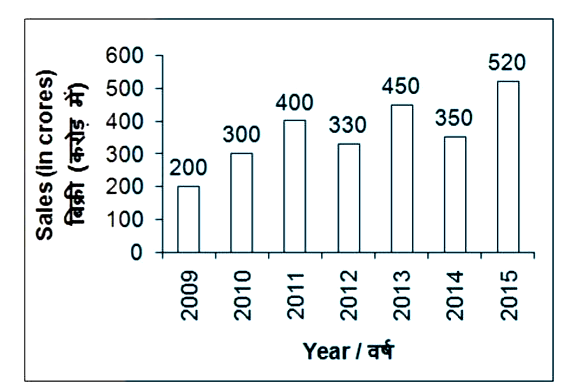
What is the percentage change in sales from year 2010 to 2014?
View Solution
Knowledge Check
The bar chart given below shows the revenue (in Rs. crores) of company A for the years 2008 to 2015.
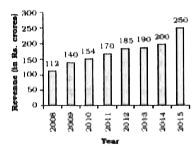
What is the percentage increase in revenue in the year 2010 in comparison to the previous year?A10B12C20D25The line chart given below shows the profit (in crores) of a company for the years 2008 to 2015.
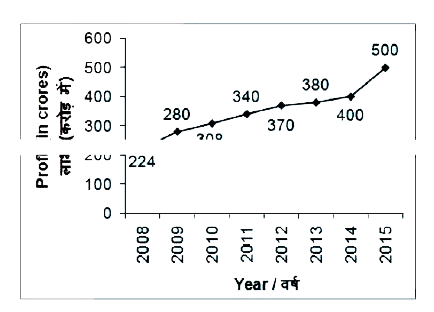
What is the percentage increase in profit in the year 2010 in comparison to the previous year ?Aa)20Bb)12Cc)10Dd)25The bar chart given below shows the revenue (in crores) of company A for the years 2008 to 2015.
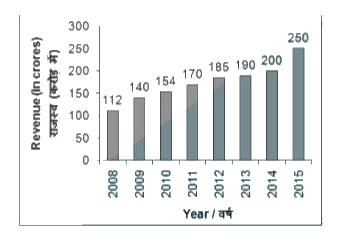
What is the average revenue (in crore Rs) per year from 2011 to 2015?Aa)199Bb)203Cc)192Dd)189
The bar chart given below shows the revenue (in crores) of company A for the years 2008 to 2015.
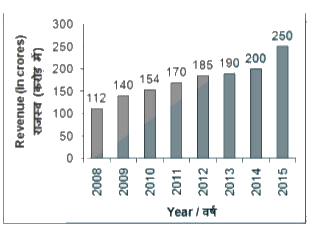
The revenue in 2015 is what percent of the revenue in 2014?
View SolutionThe bar chart given below shows the revenue (in Rs. crores) of company A for the years 2008 to 2015.
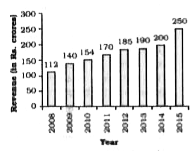
The revenue in 2015 is what per cent of the revenue in 2014?
View SolutionThe table given below shows the revenue (in crores) of a company from years 2010 to 2016)
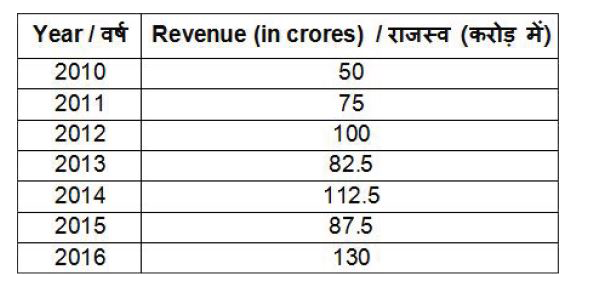
What is the percentage change in revenue from year 2011 to 2015?
View SolutionThe bar chart given below shows the revenue (in Rs. crores) of company A for the years 2008 to 2015.
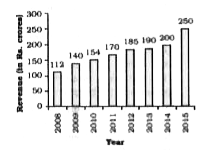
What is the average revenue (in Rs. crores) per year from 2011 to 2015?
View SolutionThe table given below shows the revenue (in crores) of a company from years 2010 to 2016)
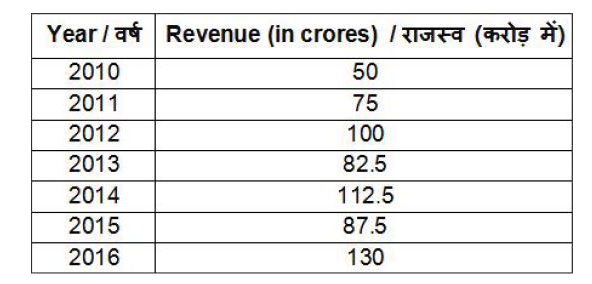
What is the percentage change in the revenue from year 2010 to 2014?
View Solution
