The pie chart below shows the distribution on land under various food crops in a village for a total cultivation area of 3000 acres. Answer the question below based on the share of different crops as shown in the chart below.
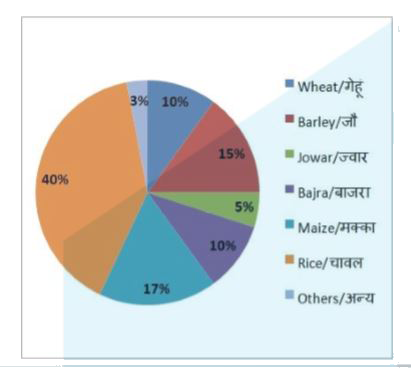
What is teh cultivation area for Maize ?
540 Acre
510 Acre
480 Acre
490 Acre
The correct Answer is:B
Step by step video, text & image solution for The pie chart below shows the distribution on land under various food crops in a village for a total cultivation area of 3000 acres. Answer the question below based on the share of different crops as shown in the chart below. What is teh cultivation area for Maize ? by Maths experts to help you in doubts & scoring excellent marks in Class 14 exams.
Updated on:21/07/2023Similar Questions
(Questions 15-19): The pie-chart shown below gives the distribution of land in a village under various food crops. Study the pie-chart carefully and answer the questions that follow: Distribution of areas (in acres) under various food crops (FIGURE) Which combination of three crops contribute to 50% of the total area under the food crops? (a) Wheat, Barley and Jowar (b) Rice, Wheat and Jowar (c) Rice, What and Barley (d) Bajra, Maize and Rice
View SolutionA college collects Rs. 180 Crores of funds different sources. Answer the question below based on the fund collection share from different sources as in given the pie chart below.
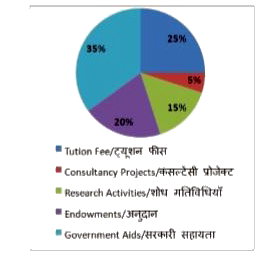
How much amount is collected from endowments?
View Solution
Knowledge Check
The pie chart below shows the distribution on land under various food crops in a village for a total cultivation area of 3000 acres. Anser the question below based on the share of different crops as shown in the chart below.
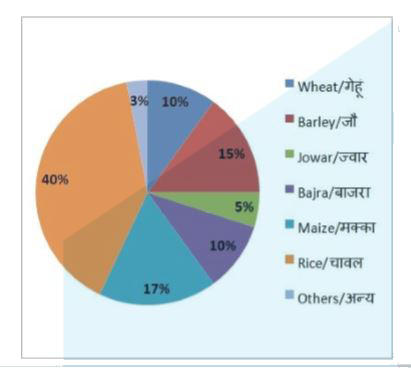
What is the total cultivation area under the food crops of Rice and Barley?A1650 AcreB1830 AcreC1800 AcreD1860 AcreThe pie chart below shows the distribution on land under various food crops in a village for a total cultivation area of 3000 acres. Answer the question below based on the share of different crops as shwon in the chart below.
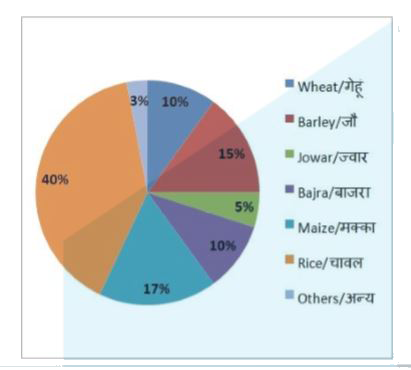
How much cultivation area is covered under Bajra and Maize?A840 AcreB870 AcreC810 AcreD960 AcreThe pie chart below shows the distribution on land under various food coprs in a village for a total cultivation area of 3000 acres. Answer the question below based on the share of different crops as shown in the chart below.
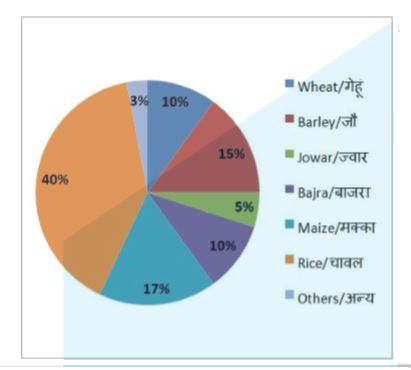
Jowar, Maize and Wheat together account for how much cultivation area of the village?A930 AcreB990 AcreC950 AcreD960 Acre
The pie chart given here shows the spendings of a country on various sports during a particular year. Study the chart carefully and answer the questions given below:
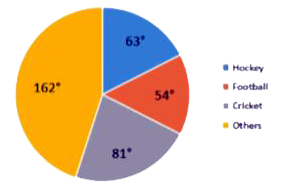
What percent of the total spendings is spent on others?
View SolutionThe pie chart given here shows the spendings of a country on various sports during a particular year. Study the chart carefully and answer the questions given below it.
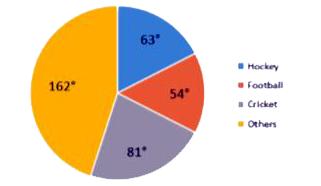
How much percent less is spent on Football than that on Cricket?
View SolutionThe pie chart drawn below shows the spendings of a country on various sports during a particular year. Study the pie chart and answer the questions.
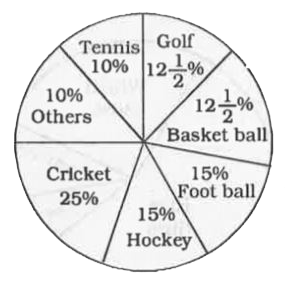
Total central angle showing the money spent on hockey, football and other during the year was
View SolutionThe pie chart given below shows the monthly expenses on various heads of a family . The total expenditure of the family is Rs 30000.
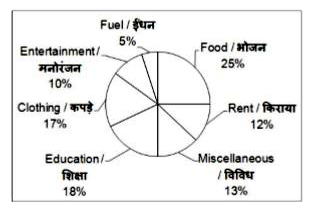
What is the amount (in Rs) spent on food ?
View SolutionThe pie chart given below shows the spendings of a family on various heads during a month. Study the graph and answer the questions
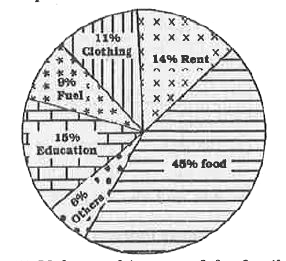
What is the ratio of the expenses on Education to the expenses on Food?
View Solution