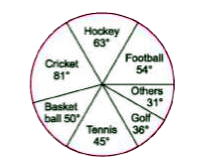
The pie chart given here shows the spendings of a country on various sports during a particular year. Study the chart carefully and answer the questions given below:
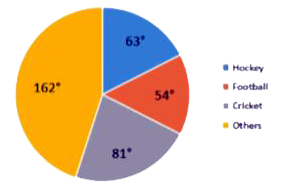
What percent of the total spendings is spent on others?
12.5%
45%
25%
22.5%
The correct Answer is:B
Step by step video, text & image solution for The pie chart given here shows the spendings of a country on various sports during a particular year. Study the chart carefully and answer the questions given below: What percent of the total spendings is spent on others? by Maths experts to help you in doubts & scoring excellent marks in Class 14 exams.
Updated on:21/07/2023Similar Questions
The pie chart given here shows the spendings of a country on various sports during a particular year. Study the graph carefully and answer the questions given below it.
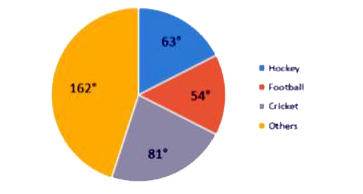
If the total amount spent on sports during the year be ₹18000, the amount spent on Cricket exceeds that on football by (in ₹):
View SolutionThe circle - graph given here shows the spendings of a country on various sports during a prticular year. Study the graph carefully and answer the questions given below It .
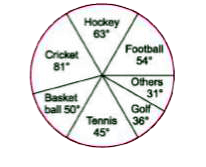
How much per cent less is spent on football than that Cricket ?
View Solution
Knowledge Check
The circle graph given here shows the spendings of a country on various sports during a particular year, study the graph carefully and answer the questions given below it.
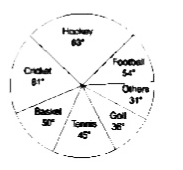
What per cent of the total spendings is spent on tennis ?A1212%B2212%C25%D45%The circle - graph given here shows the spendings of a country on various sports during a prticular year. Study the graph carefully and answer the questions given below It .
What per cent of the total spendings is Sent on Tennis ?A1212 %B2212 %C0.25D0.45The pie chart given here shows the spendings of a country on various sports during a particular year. Study the chart carefully and answer the questions given below it.
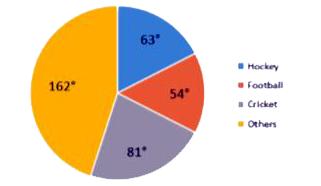
How much percent less is spent on Football than that on Cricket?A33with13%B1212%C2012%D25%
The circle graph given here shows the spendings of a country on various sports during a particular year, study the graph carefully and answer the questions given below it.
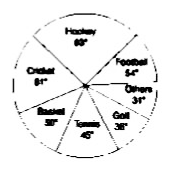
How much percent less is spent on Football than that on cricket?
View SolutionThe circle - graph given here shows the spendings of a country on various sports during a prticular year. Study the graph carefully and answer the questions given below It .
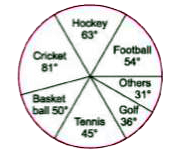
How much percent more is spent on Hockey than that on Golf?
View SolutionThe circle - graph given here shows the spendings of a country on various sports during a prticular year. Study the graph carefully and answer the questions given below It .
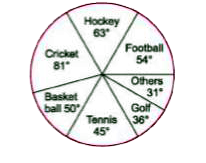
If the total amount spent on sports during the year was Rs 2 crore, then amount spent on Cricket and Hockey together was
View SolutionThe circle - graph given here shows the spendings of a country on various sports during a prticular year. Study the graph carefully and answer the questions given below It .
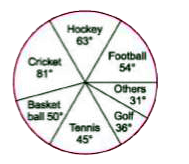
If the total amount spent on sports during the year be Rs 18000000, then amount spent on Basketball ex- ceeds that on Tennis by
View SolutionThe circle graph given here shows the spendings of a country on various sports during a particular year, study the graph carefully and answer the questions given below it.
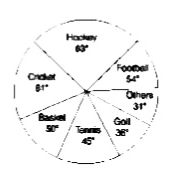
How much per cent more is spent on Hockey than that on golf?
View Solution
