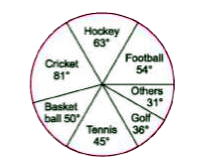
The pie chart given here shows the spendings of a country on various sports during a particular year. Study the graph carefully and answer the questions given below it.
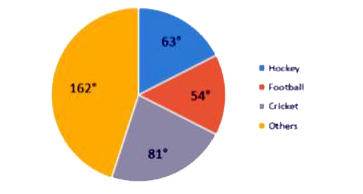
If the total amount spent on sports during the year be ₹18000, the amount spent on Cricket exceeds that on football by (in ₹):
2800
1350
3000
2550
The correct Answer is:B
Step by step video, text & image solution for The pie chart given here shows the spendings of a country on various sports during a particular year. Study the graph carefully and answer the questions given below it. If the total amount spent on sports during the year be ₹18000, the amount spent on Cricket exceeds that on football by (in ₹): by Maths experts to help you in doubts & scoring excellent marks in Class 14 exams.
Updated on:21/07/2023Similar Questions
The pie chart,drawn, shows the spending of a country on various sports during a particular year. Study the graph carefully and answer the questions that follow.
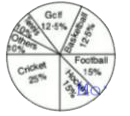
If the total amount spent on sports during the year was Rs 30,00,000 the amount spent on Cricket and Hockey together was
View SolutionThe pie chart given here shows the spendings of a country on various sports during a particular year. Study the chart carefully and answer the questions given below:
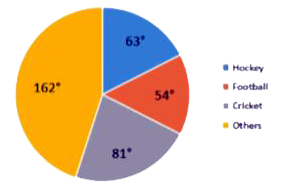
What percent of the total spendings is spent on others?
View Solution
Knowledge Check
The circle graph given here shows the spendings of a country on various sports during a particular year, study the graph carefully and answer the questions given below it.
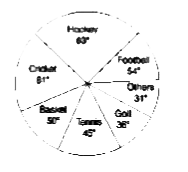
If the total amount spent on sports during the year was Rs 72 crore, the amount spent on circket exceed that on hockey byARs78000000BRs 36000000CRs 12000000DRs16000000The circle graph given here shows the spendings of a country on various sports during a particular year, study the graph carefully and answer the questions given below it.
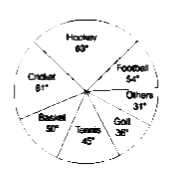
If the total amount spent on sports during the year beRs 522,000,000, the amount spent on basketball ex- ceeds that on tennis byARs 7250000BRs 7360000CRs 7375000DRs 7410000The circle - graph given here shows the spendings of a country on various sports during a prticular year. Study the graph carefully and answer the questions given below It .
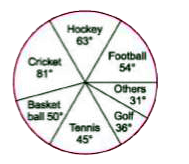
If the total amount spent on sports during the year be Rs 18000000, then amount spent on Basketball ex- ceeds that on Tennis byARs 250000BRs 360000CRs 375000DRs 410000
The circle - graph given here shows the spendings of a country on various sports during a prticular year. Study the graph carefully and answer the questions given below It .
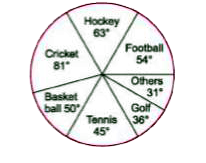
If the total amount spent on sports during the year was Rs 2 crore, then amount spent on Cricket and Hockey together was
View SolutionThe circle graph given here shows the spendings of a country on various sports during a particular year, study the graph carefully and answer the questions given below it.
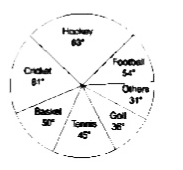
What per cent of the total spendings is spent on tennis ?
View SolutionThe circle - graph given here shows the spendings of a country on various sports during a prticular year. Study the graph carefully and answer the questions given below It .
What per cent of the total spendings is Sent on Tennis ?
View SolutionThe pie chart given here shows the spendings of a country on various sports during a particular year. Study the chart carefully and answer the questions given below it.
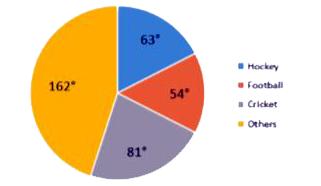
How much percent less is spent on Football than that on Cricket?
View SolutionThe pie chart drawn below shows the spendings of a country on various sports during a particular year. Study the pie chart and answer the questions.
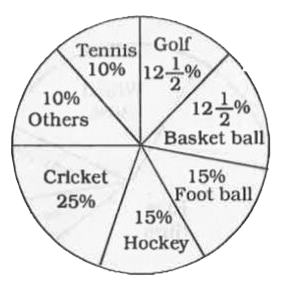
If, the total amount spent on sports during the year was Rs. 1,20,00,000, how much was spent on basketball ?
View Solution
