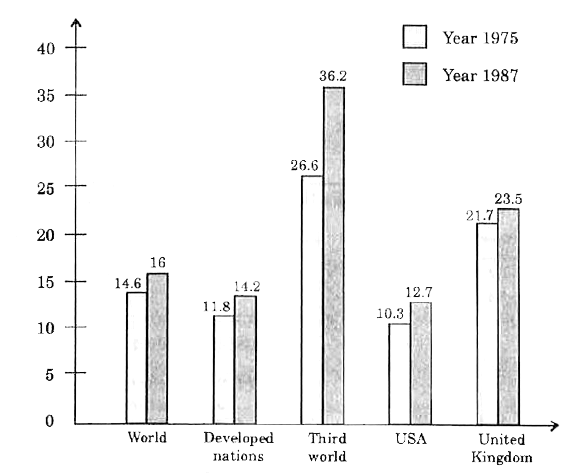
Study the following Bar graph and answer the question. The Bar graph gives the annual rates of inflation in percentages for 1975 and 1987:
निम्नलिखित बार-ग्राफ का अध्ययन करें और प्रश्नों का उत्तर दें। बार-ग्राफ में वर्ष 1975 से 1987 तक प्रतिशत में मुद्रा स्फीति की वार्षिक दर प्रतिशत में दी गई है :
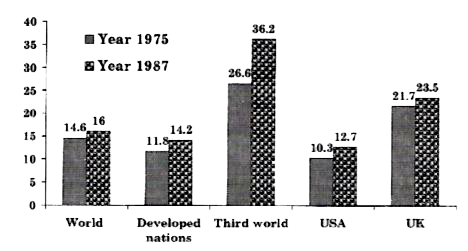
The change in rate of inflation was least in which of the following.
मुद्रास्फीति के परिवर्तन की निम्नतम दर इन में से कहाँ थी?
Developed Nations / विकसित देशों में
UK/ यू. के.
World / विश्व में
Third world / तीसरी दुनिया में
The correct Answer is:B
विश्व की मुद्रास्फीति =16−14−614.6≈10%
विकसित देशों की मुद्रास्फीति =360×4100≈14.4∘
तीसरी दुनिया की मुद्रास्फीति =36.2−26.626.6×100≈36%
USA की मुद्रास्फीति =12.7−10.310.3×100≈23%
UK की मुद्रास्फीति =23.5−21.721.7×100≈8%
अत: UK की मुद्रास्फीति की दर न्यूनतम है।
Similar Questions
Study the following bar graph and answer the questions given below.
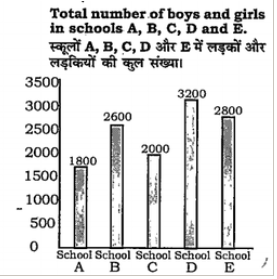
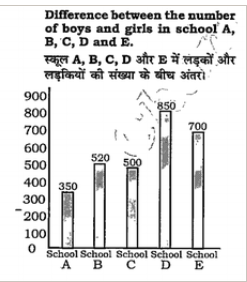 . The number of boys in school B
is what percentage of the number of students in that school?
निम्नांकित बार ग्राफ का अध्ययन कीजिए और उसके बाव दिए गए प्रश्न का उत्तर दीजिए।
 . स्कूल B में लड़कों की संख्या, उस स्कूल में
विद्यार्थियों की कुल संख्या की कितने प्रतिशत है?
View SolutionStudy the chart and answer the questions:
In which of the given years is the percentage increase in the number of hotels in comparison to the previous year, is the maximum?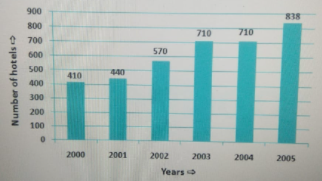
चार्ट का अध्ययन करें और प्रश्नों का उत्तर दें:पिछले वर्ष की तुलना में होटलों की संख्या में किस वर्ष में अधिकतम प्रतिशत वृद्धि हुई है?
View Solution
Knowledge Check
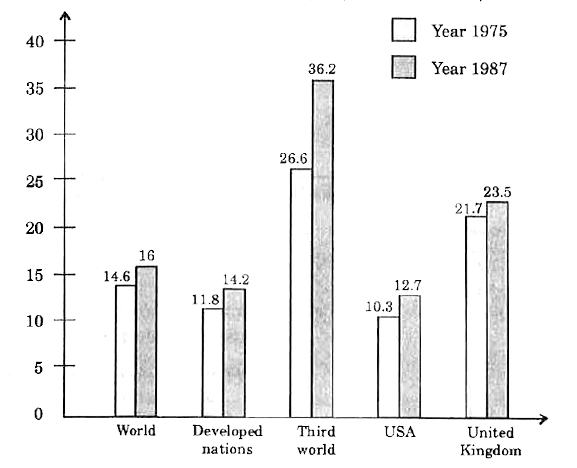
Study the following Bar Graph and answer the questions. The Bar Graph gives the annual rates of inflation in percentage for 1975 and 1987.
The change in rate of inflation was least in which of the following ?ADeveloped NationsBUnited KingdomCWorldDThird worldStudy the following Bar Graph and answer the questions. The Bar Graph gives the annual rates of inflation in percentage for 1975 and 1987.
From 1975 to 1987, inflation rate increased in the third world countries approximately byA10%B20%C30%D36%Study the following Bar Graph and answer the questions. The Bar Graph gives the annual rates of inflation in percentage for 1975 and 1987.
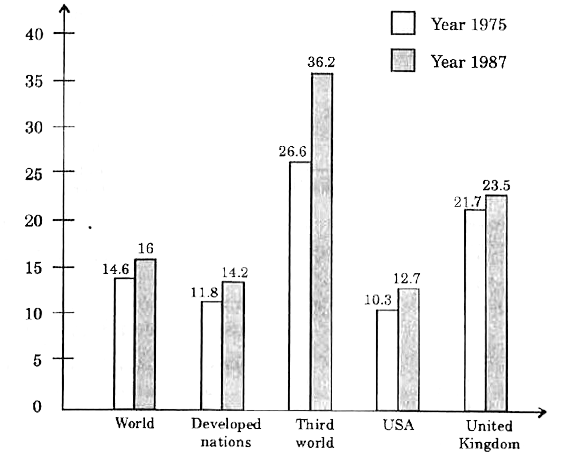
Comparing the figures for USA vis-à-vis the developed nation, it can be concluded that.AUSA had better control on inflationBDeveloped nations had better control on inflationCThe inflation rate continues to be the same for USA and developed nationsDNo conclusions can be drawn
Observe the following bar-graph carefully and answer the following questions: The birth rate of Country C is approximately what percentage of the birth rate of Country E?
निम्नलिखित दंड आरेख को ध्यान से देखें और निम्नलिखित प्रश्नों के उत्तर दें: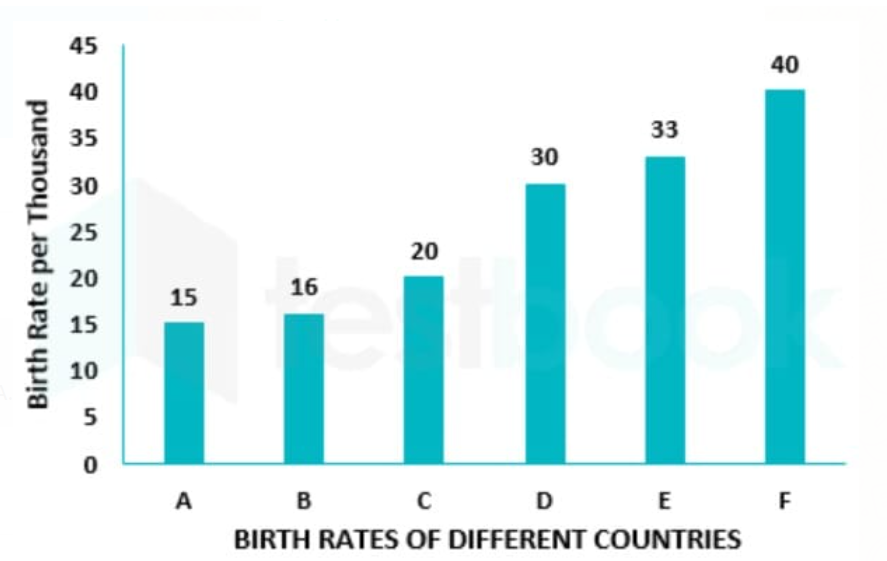
देश C की जन्म दर, देश E की जन्म दर का लगभग कितना प्रतिशत है?
View SolutionStudy the following graph and answer the given questions:
निम्न ग्राफ का अध्ययन कीजिए और दिये गये प्रश्नों के उत्तर दीजिए:
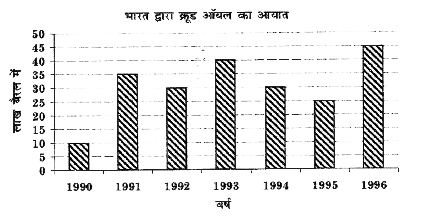
From year 1995 to the year 1996, what was the percentage increase in imports of crude oil?
वर्ष 1995 से वर्ष 1996 तक क्रूड ऑयल के आयात में कितने प्रतिशत वृद्धि हुई?
View SolutionStudy the following Bar Graph and answer the questions. The Bar Graph gives the annual rates of inflation in percentage for 1975 and 1987.
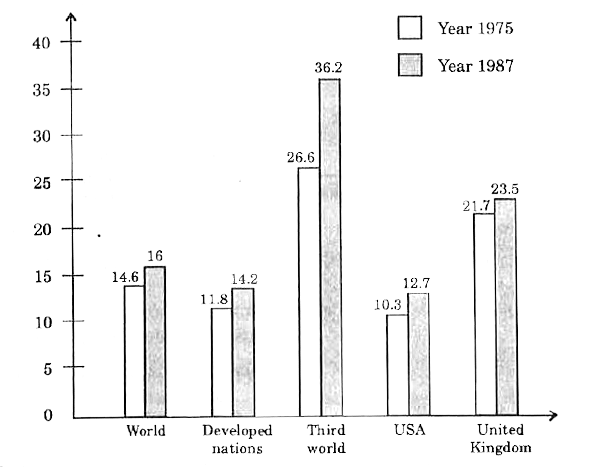
In the year 1987, the inflation rate in the third world countries vis-à-vis the world jumped approximately by
View SolutionStudy the following bar diagram carefully and answer the following questions :
निम्नलिखित आरेख का ध्यानपूर्वक अध्ययन करें और दिए गए प्रश्नों का उत्तर दें:
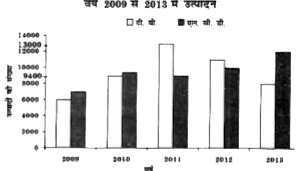
The ratio of production of LCDs in the year 2011 and 2013 is.
वर्ष 2011 और 2013 में एल. सी. डी. के उत्पादन का अनुपात है
View SolutionStudy the following bar diagram carefully and answer the following questions :
निम्नलिखित आरेख का ध्यानपूर्वक अध्ययन करें और दिए गए प्रश्नों का उत्तर दें:
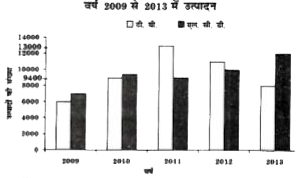
The ratio of production of TVs in the years 2009 and 2010 is.
वर्ष 2009 और 2010 में टी. वी. के उत्पादन का अनुपात -
View Solution
