Study the following bar diagram carefully and answer the following questions :
निम्नलिखित आरेख का ध्यानपूर्वक अध्ययन करें और दिए गए प्रश्नों का उत्तर दें:
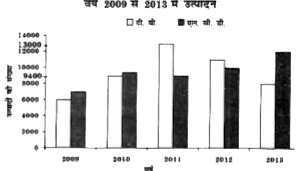
The ratio of production of LCDs in the year 2011 and 2013 is.
वर्ष 2011 और 2013 में एल. सी. डी. के उत्पादन का अनुपात है
(a) 4:3
(b) 2:3
(c)1:4
(d)3:4
The correct Answer is:D
अभीष्ट अनुपात = 9000 : 12000 = 3:4
Similar Questions
Study the following bar diagram and answer the question that follows.
निम्नलिखित दंड आरेख का अध्ययन करें और उस प्रश्न का उत्तर दें जो पूछा गया है। The production (in thousands) of electronic items (TV and LCD) in a factory during the period from 2011 to 2015.
2011 से 2015 की अवधि के दौरान एक कारखाने में इलेक्ट्रॉनिक वस्तुओं (TV और LCD) का उत्पादन (हजारों में)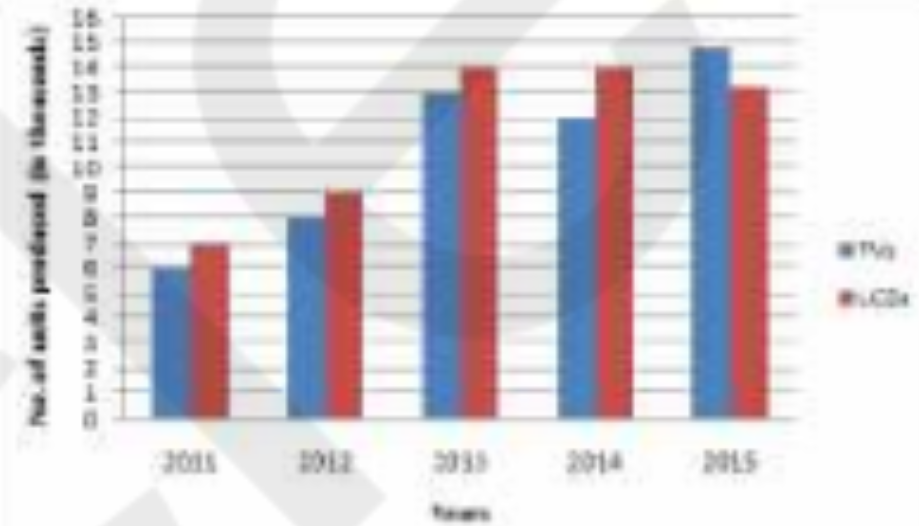 The ratio of the total production of LCDs in the year 2012 and 2014 to the total production of TV’s in the year 2012 and 2014 is:
वर्ष 2012 और 2014 में एलसीडी के कुल उत्पादन और वर्ष 2012 और 2014 में टीवी के कुल उत्पादन का अनुपात है:
View SolutionStudy the following bar diagram carefully and answer the following questions. The number of the production of electronic items (TVs and LCDs) in a factory during the period from 2009 to 2013.
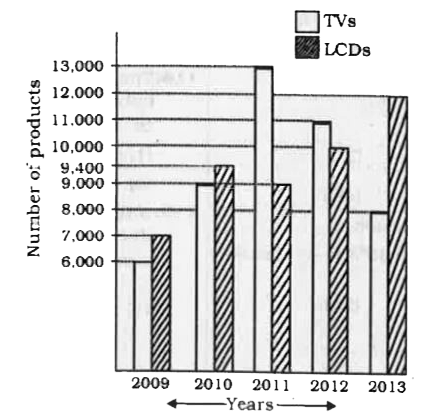
The ratio of production of LCDs in the year 2011 and 2013 is
View Solution
Knowledge Check
Study the following bar diagram carefully and answer the following questions :
निम्नलिखित आरेख का ध्यानपूर्वक अध्ययन करें और दिए गए प्रश्नों का उत्तर दें:
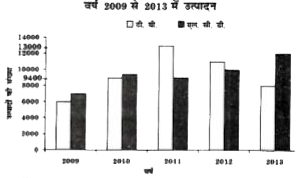
The ratio of production of TVs in the years 2009 and 2010 is.
वर्ष 2009 और 2010 में टी. वी. के उत्पादन का अनुपात -A(a)7:6B(b) 2:3C(c) 6:7D(d) 3:2Study the following bar diagram carefully and answer the following questions :
निम्नलिखित आरेख का ध्यानपूर्वक अध्ययन करें और दिए गए प्रश्नों का उत्तर दें:
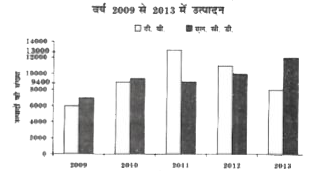
The difference between averages of production of TVs and LCDs from 2009 to 2012 is.
वर्ष 2009 से 2012 तक टी. वी. और एल. सी. डी. के उत्पादन के औसत में अंतर हैA(a) 700B(b) 900C(c) 600D(d) 800Study the following bar diagram carefully and answer the following questions :
:
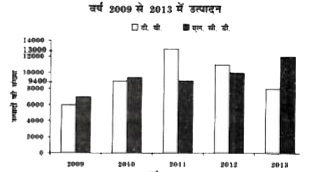
The total number of a products of electronic items is maximum in the year.A(a) 2010B(b) 2009C(c) 2011D(d) 2013
Study the following diagram and answer the given question.
निम्नलिखित आरेख का अध्ययन करें और दिए गए प्रश्न का उत्तर दें।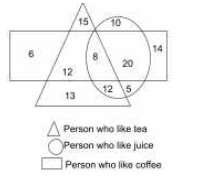 How many people like both tea and coffee, but do NOT like juice?
कितने लोग चाय और कॉफी दोनों पसंद करते हैं, लेकिन जूस पसंद नहीं करते?
View SolutionStudy the following bar graph and answer the question given.
निम्नलिखित दंड आरेख का अध्ययन करें तथा दिए गए प्रश्न का उत्तर दें |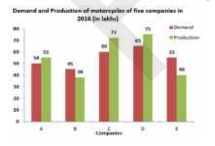 The ratio of the total demand of motorcycles of companies A, C and E to the total production of
motorcycles of B and C is:
कंपनी A, C और E की मोटरसाइकिल की कुल मांग और B तथा C की मोटरसाइकिल के कुल उत्पादन के बीच अनुपात ज्ञात करें
View SolutionStudy the following bar graph and answer the question given.
निम्नलिखित दंड आरेख का अध्ययन करें तथा दिए गए प्रश्न का उत्तर दें |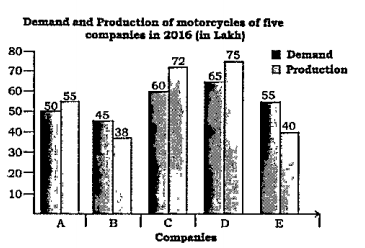 The number of companies whose production of motorcycles is equal to or more than the average demand of motorcycles (per year) over five years is:
ऐसी कंपनियों की संख्या कितनी है जिसका मोटरसाइकिल उत्पादन इन पांच वर्षों के दौरान मोटरसाइकिलों की औसत मांग (प्रति वर्ष ) से अधिक या बराबर रहा है ?
View SolutionStudy the following pattern and find the missing number from the given options.
निम्नलिखित पैटर्न का अध्ययन करें और दिए गए विकल्पों में से लापता संख्या ज्ञात करें।
View SolutionStudy the following bar graph and answer the question given.
निम्नलिखित दंड आरेख का अध्ययन करें तथा दिए गए प्रश्न का उत्तर दें |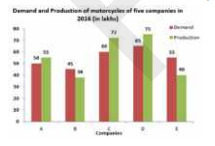 The total production of motorcycles of companies C, D and E is what percent less than the total demand of motorcycles of all the companies during five years?
कंपनी C, D और E की मोटरसाइकिल का कुल उत्पादन पांच वर्षों के दौरान सभी कंपनियों की मोटरसाइकिलों की कुल मांग से कितना प्रतिशत कम है ?
View Solution
