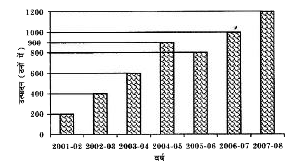
Study the chart carefully and answer the questions.
The chart shows production of an item (in tones) during certain years.
The production decreased from 2004-05 to 2005 - 06 by
निम्न आरेख का ध्यानपूर्वक अध्ययन कर दिए गए प्रश्नों के उत्तर दें:
आरेख किसी वर्ष के दौरान एक मद का उत्पादन (टनों में) दर्शाता है।
वर्ष 2004-05 से 2005-06 में उत्पादन में कितनी कमी हुई ?
1019%
1119%
819%
919%
The correct Answer is:B
% कमी = 900−800900×100=19×100=1119%
Similar Questions
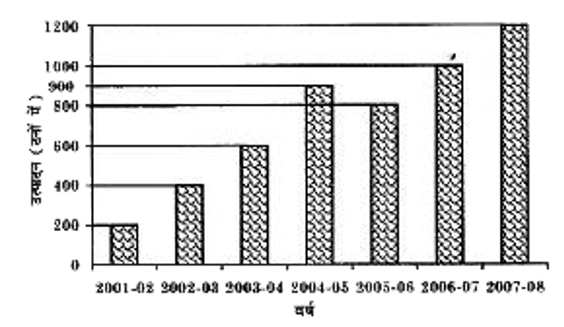
Study the chart carefully and answer the questions.
The chart shows production of an item (in tones) during certain years.
The production from 2003-04 to 2007-08 increased by.
-
View SolutionStudy the chart carefully and answer the questions.
The chart shows production of an item (in tones) during certain years.
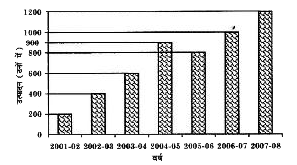
The production in 2006-07 in comparison to the production in 2002-03 increased by.
निम्न आरेख का ध्यानपूर्वक अध्ययन कर दिए गए प्रश्नों के उत्तर दें:
आरेख किसी वर्ष के दौरान एक मद का उत्पादन (टनों में) दर्शाता है।
वर्ष 2002-03 की तुलना में 2006-07 में उत्पादन में वृद्धि हुई -
View Solution
Knowledge Check
Study the chart carefully and answer the questions
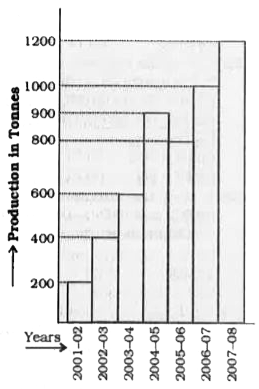
The chart shows production of an item (in tonnes) during certain years .
The production decreased from 2004-05 to 2205-06 byA1119%B819%C919%D1019%Study the graph carefully and answer the questions.
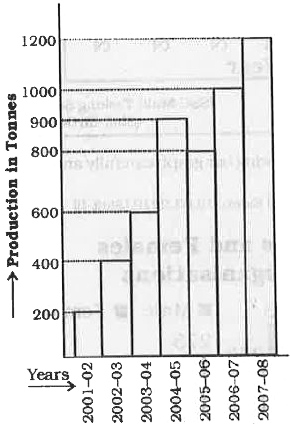
The graph shows production of an item (in tonnes) during certain years
The production decreased from 2004-05 to 2005-06 byA1119%B819%C919%D1019Study the chart carefully and answer the questions
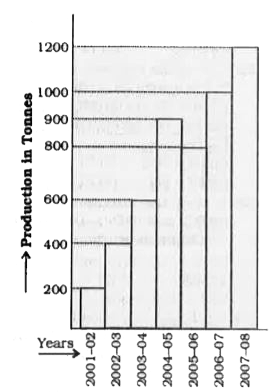
The chart shows production of an item (in tonnes) during certain years .
The production from 2003-04 to 2007-08 increased byA125%B50%C75%D100%
Study the chart and answer the questions:
In which of the given years is the percentage increase in the number of hotels in comparison to the previous year, is the maximum?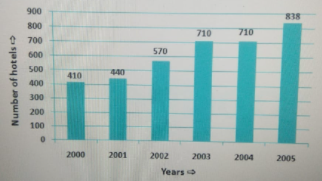
चार्ट का अध्ययन करें और प्रश्नों का उत्तर दें:पिछले वर्ष की तुलना में होटलों की संख्या में किस वर्ष में अधिकतम प्रतिशत वृद्धि हुई है?
View SolutionThe bar graph given below shows the wheat production (in tonnes) of a large farm during the year 2011-2018. In how many years was wheat production higher than the average production of the period?
नीचे दिए गए दंड आरेख में वर्ष 2011-2018 के दौरान किसी बड़े फार्म के गेहूं उत्पादन (टन में) को दर्शाया गया है | अवधि के औसत उत्पादन की तुलना में दिए गए कितने वर्षो में गेहूं उत्पादन अधिक था ?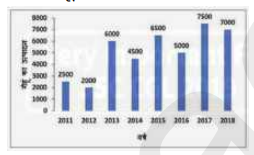
View SolutionStudy the following frequency polygon and answer the questions. Given a line graph showing the number of students passed in Higher Secondary Examination in a school over the years 2008 to 2013:
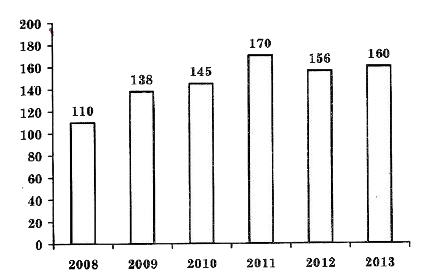
The decrease in percentage of passed students from 2011 to 2012 approximately is.
निम्नलिखित बारम्बारता बहुभुज का अध्ययन करें और दिए गए प्रश्नों के उत्तर दें। नीचे रेखा ग्राफ में एक स्कूल में वर्ष 2008 से 2018 तक के वर्षों में उच्चतर माध्यमिक परीक्षा में उत्तीर्ण होने वाले विद्यार्थियों की संख्या दर्शायी गई है :
वर्ष 2011 से 2012 तक उत्तीर्ण होने वाले विद्यार्थियों की प्रतिशतता में लगभग कितनी कमी आई है?
View SolutionStudy the following bar diagram carefully and answer the following questions :
निम्नलिखित आरेख का ध्यानपूर्वक अध्ययन करें और दिए गए प्रश्नों का उत्तर दें:
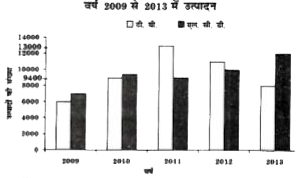
The ratio of production of TVs in the years 2009 and 2010 is.
वर्ष 2009 और 2010 में टी. वी. के उत्पादन का अनुपात -
View SolutionStudy the following bar diagram carefully and answer the following questions :
निम्नलिखित आरेख का ध्यानपूर्वक अध्ययन करें और दिए गए प्रश्नों का उत्तर दें:
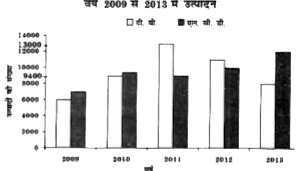
The ratio of production of LCDs in the year 2011 and 2013 is.
वर्ष 2011 और 2013 में एल. सी. डी. के उत्पादन का अनुपात है
View Solution
