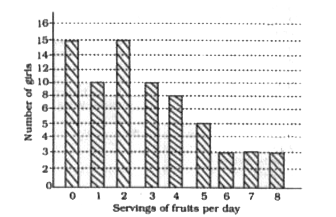
The distribution of fruit consumption in a sample of 73 seventeen-year-old girls is given in the graph below. Study the graph and answer the questions :
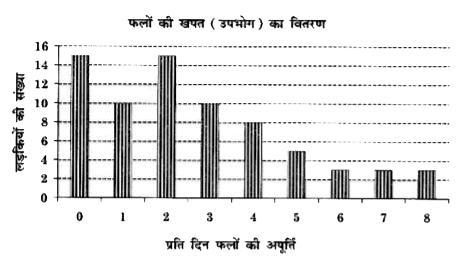
How many of these girls ate fewer than two servings per day?
निम्नलिखित ग्राफ में 72 सत्रह - वर्षीय लड़कियों के सैम्पल में फलों की खपत (उपभोग) के विवरण को दर्शाया गया है। ग्राफ का अध्ययन कीजिए और प्रश्नों के आधार पर उत्तर दीजिए:
इनमें से कितनी लड़कियों ने प्रति दिन दो से कम आपूर्ति किए गए फलों को खाया?
25
40
15
None of these / इनमें से कोई नहीं
The correct Answer is:A
ग्राफ से स्पष्ट है कि (10 + 15) = 25 लड़कियों ने प्रतिदिन 2 से कम फल खाये।
Similar Questions
The distribtution of fruit consumption in a sample of 72 seventeen - year - old girls is given in the graph below. Study the graph and answer the questions.
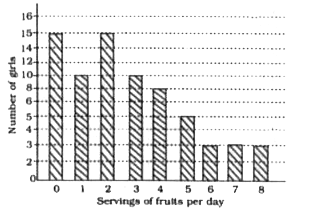
How many of these girls ate fewer than two servings per day ?
View SolutionThe distribution of fruit consumption in a sample of 73 seventeen-year-old girls is given in the graph below. Study the graph and answer the questions :
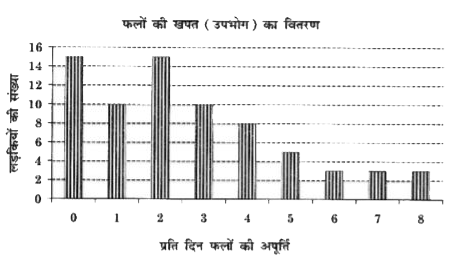
How many of these girls ate more than two servings but less than six servings per day?
निम्नलिखित ग्राफ में 72 सत्रह - वर्षीय लड़कियों के सैम्पल में फलों की खपत (उपभोग) के विवरण को दर्शाया गया है। ग्राफ का अध्ययन कीजिए और प्रश्नों के आधार पर उत्तर दीजिए:
इनमें से कितनों लड़कियों ने प्रति दिन दो से अधिक किन्तु छह से कम आपूर्ति किए गए फलों को खाया?
View SolutionThe distribtution of fruit consumption in a sample of 72 seventeen - year - old girls is given in the graph below. Study the graph and answer the questions.

How many of these girls ate fewer than two servings per day ?
View SolutionThe distribution of fruit consumption in a sample of 73 seventeen-year-old girls is given in the graph below. Study the graph and answer the questions :
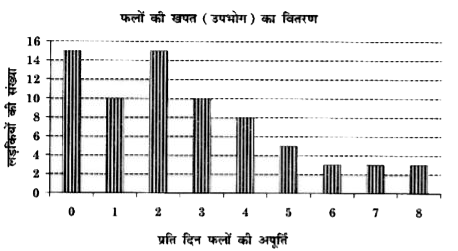
What percent of these girls ate six or more servings per day?
निम्नलिखित ग्राफ में 72 सत्रह - वर्षीय लड़कियों के सैम्पल में फलों की खपत (उपभोग) के विवरण को दर्शाया गया है। ग्राफ का अध्ययन कीजिए और प्रश्नों के आधार पर उत्तर दीजिए:
प्रति दिन छह या अधिक आपूर्ति किए गए फलों को खाने वाली इन लड़कियों का प्रतिशत क्या था?
View SolutionThe distribtution of fruit consumption in a sample of 72 seventeen - year - old girls is given in the graph below. Study the graph and answer the questions.
What percent of these girls ate six or more servings per day ?
View SolutionThe distribution of fruit consumption in a sample of 72 seventeen - year - old girls is given in the graph below. Study the graph and answer the question.
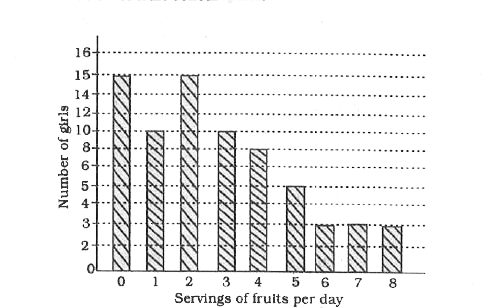
How many of these girls ate more than two servings but less than six serving per day ?
View SolutionThe distribtution of fruit consumption in a sample of 72 seventeen - year - old girls is given in the graph below. Study the graph and answer the questions.
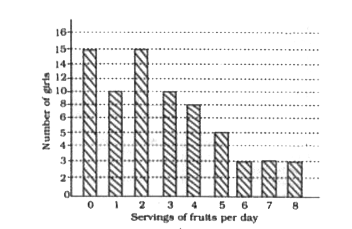
How many of these girls ate more than two servings but less than six servings per day ?
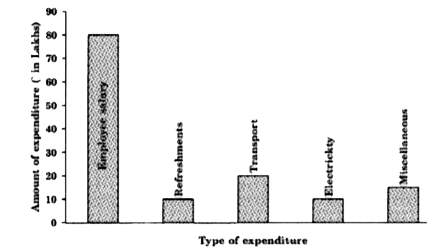
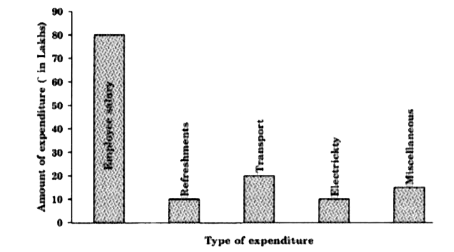
View SolutionThe graph shows the monthly expenditure of a company (unit = 10 lakhs). Study the graph and answer the questions :
The total monthly expenditure of the company is :
ग्राफ में किसी कम्पनी के मासिक व्यय को दर्शाया गया है। ग्राफ का अध्ययन कीजिए और निम्नलिखित प्रश्नों के उत्तर दीजिए।
कम्पनी का कुल मासिक व्यय कितना है ?
View SolutionThe graph shows the monthly expenditure of a company (unit = 10 lakhs). Study the graph and answer the questions :
The ratio between transport and employee salary on monthly basis is
ग्राफ में किसी कम्पनी के मासिक व्यय को दर्शाया गया है। ग्राफ का अध्ययन कीजिए और निम्नलिखित प्रश्नों के उत्तर दीजिए।
मासिक आधार पर परिवहन और कर्मचारियों के वेतन के बीच अनुपात कितना है ?
View Solutionनिम्नलिखित प्रश्नों के उत्तर दीजिए :
शुद्ध सोना और गिन्नी के सोने में क्या अन्तर है ?
View Solution
